Freshwater Change
The alteration of surface and groundwater systems that support people and ecosystems.
Current State
Human actions change how freshwater flows and stocks are distributed on land and in the atmosphere. Specifically greenhouse gas emissions, irrigation and other water uses, water infrastructures, and the expansion of agricultural land have changed the global water cycle.
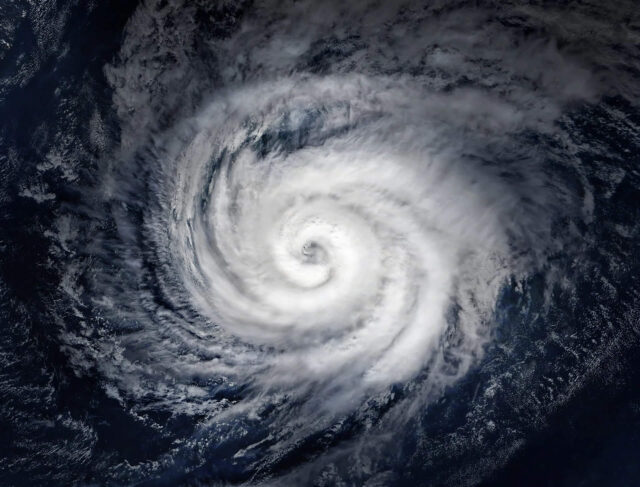
This has pervasive impacts on freshwater resources; the occurrence of droughts and storms has increased, while groundwater stocks are under depletion and river flows to the ocean are widely disrupted. The Planetary Boundary for freshwater change measures how far streamflow and soil moisture conditions have deviated from a quasi-stable state that is largely unaffected by human actions.
Anomalously dry or wet streamflow and soil moisture conditions now occur on approximately double as large land areas than under pre-industrial-like conditions, due to extensive human impacts on the freshwater cycle. This surpasses the safe limit for human modification of the water cycle and places the Freshwater Change boundary in the increasing risk zone. Increasing freshwater anomalies undermine terrestrial and aquatic ecosystem integrity and modify land carbon balance. They also critically change water availability for human uses.
Global risk map of Earth’s freshwater systems for "Blue Water"
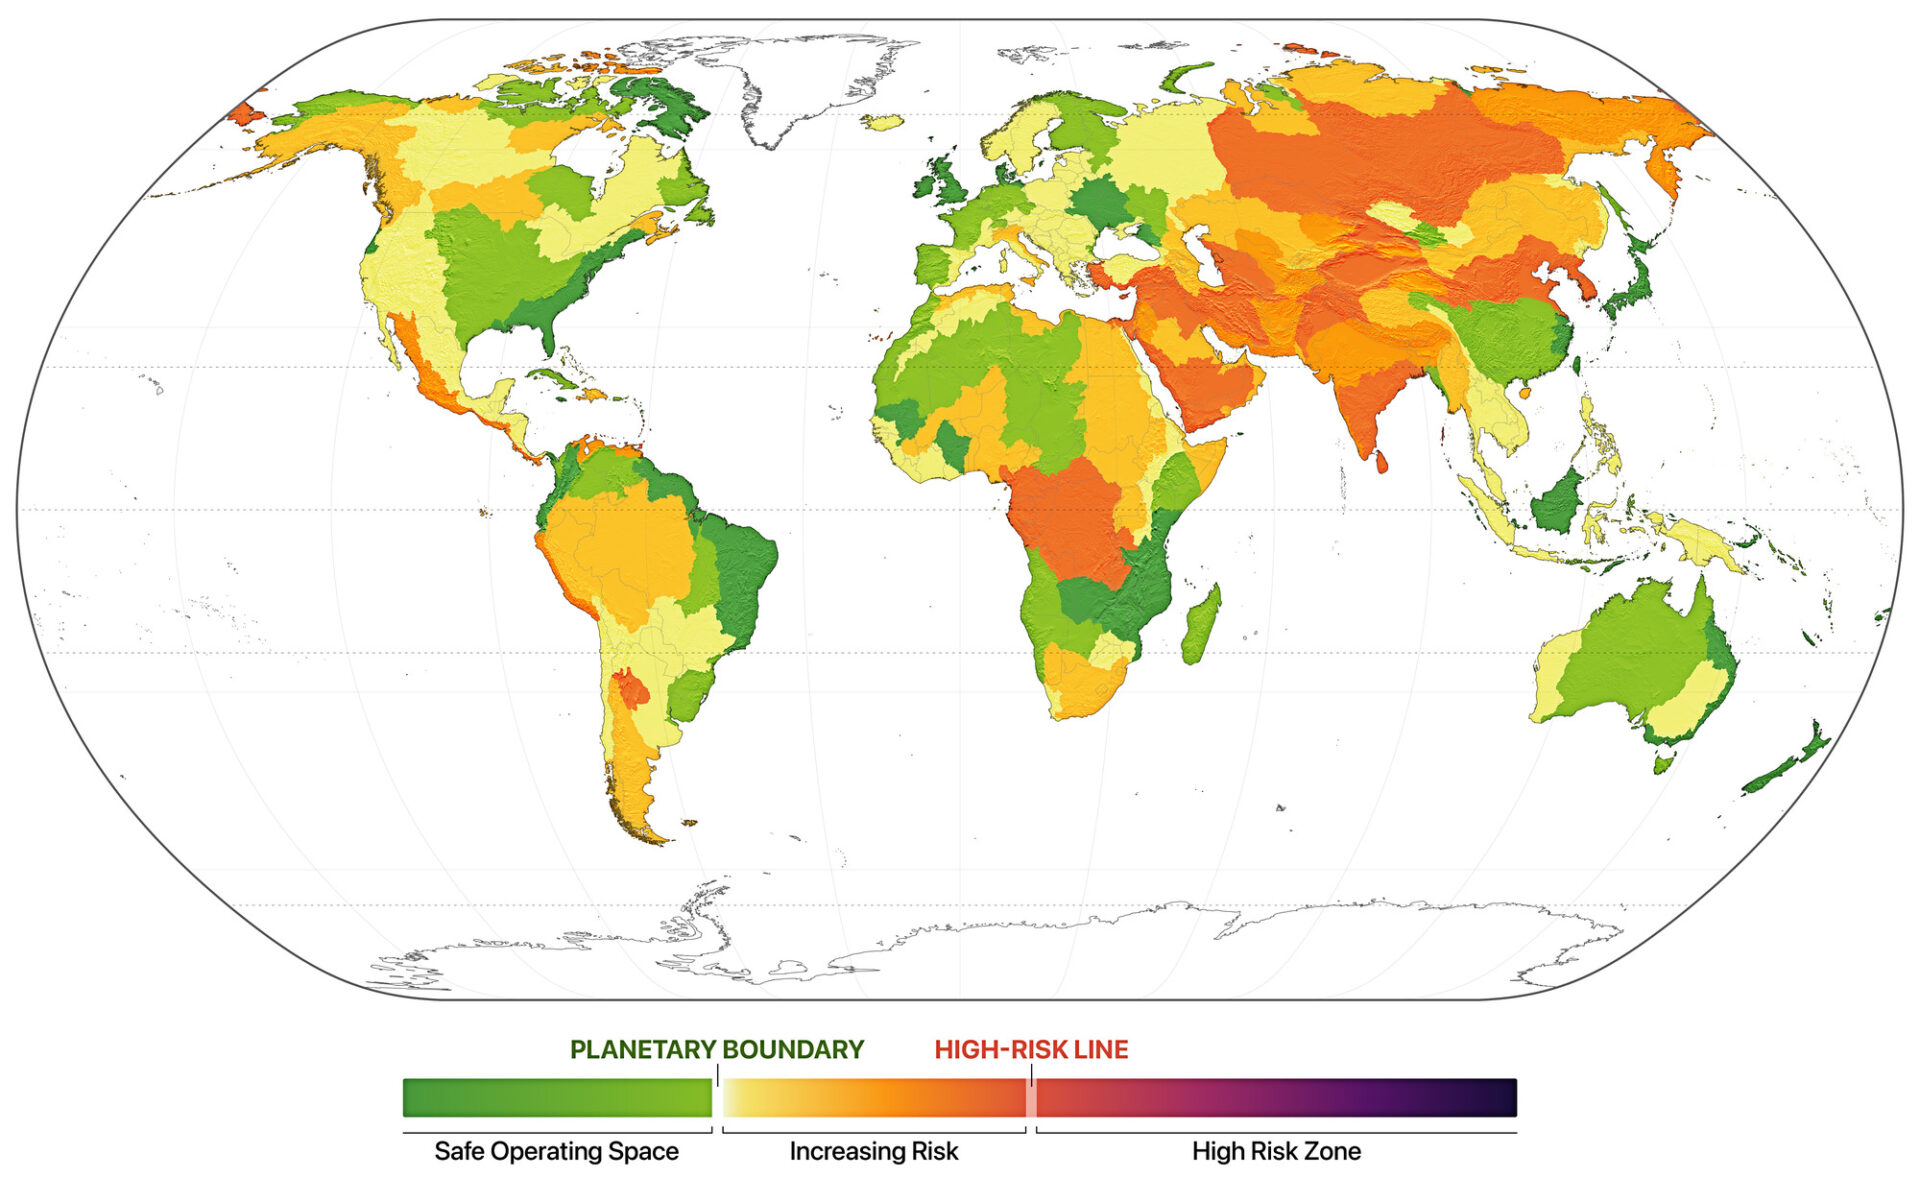
This map shows boundary transgression at river basin scale for major basins of the world. Transgression is based on the control variable streamflow alteration. Based on data from Virkki et al. (2025).
The increase in both wet and dry streamflow deviations across large parts of the world suggests increasing variability and instability in global freshwater systems.
Impacts
Water is essential for life, linking the atmosphere, land, and biosphere through a delicate global cycle. When this balance is disrupted — by overuse, shifting rainfall patterns, or the loss of forests and vegetation that help regulate water flow — the consequences ripple through the Earth system. Conditions that are too dry or too wet threaten biodiversity, alter local and regional climates, and jeopardize food and water security for millions of people.
Ecosystem degradation and loss of resilience
Disrupted water cycles can dry out wetlands, drain lakes, and destabilize ecosystems like the Amazon rainforest. As ecosystems lose water, they also lose their ability to support biodiversity and regulate the climate.

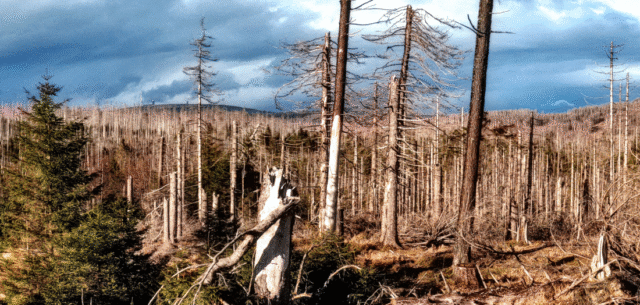
Rising drought and fire risk
Less soil moisture and reduced rainfall make landscapes more vulnerable to drought and wildfires. These events can trigger large releases of carbon dioxide, further amplifying climate change.

Increased flooding and water extremes
Excess water flow from altered rainfall patterns or overfilled rivers leads to extreme flooding. This disrupts habitats, erodes soils, and can have devastating impacts on human settlements.

Threats to food and water security
Water scarcity, especially during droughts, limits crop production and livestock health. Since human water demand is often highest during droughts, water deficits caused by withdrawals and weather conditions often reinforce each other, making the strain on ecosystems and communities even worse.


Ayisha Siddiqa Climate and human-rights advocate, J.D. Candidate, UCLA Law, Founder & Executive Director, Future Generations Tribunal, Planetary Guardian.
“As a collective, we are committed to elevating the Planetary Boundaries framework, so that every country adopts its groundbreaking approach to restoring our planet. We need to work together across generations to protect the present and the future.”
Ayisha Siddiqa Climate and human-rights advocate, J.D. Candidate, UCLA Law, Founder & Executive Director, Future Generations Tribunal, Planetary Guardian.
Key Drivers
Climate Change
Climate change has become the main global driver of freshwater disruption. A warmer atmosphere holds more moisture and changes how and where rain falls, leading to more intense floods in some regions and severe droughts in others. These shifts are transforming long-established rainfall and river patterns, creating new and unpredictable hydrological conditions that put pressure on both ecosystems and human societies.
Water withdrawals and infrastructure
Human use of water, especially for agriculture, is another major driver of freshwater change. Irrigation alone accounts for about 70% of all freshwater withdrawals, and around 90% of the water that is consumed and not returned to the source. Large-scale river diversions, dams, and groundwater pumping have dramatically altered the flow and storage of blue water, lowering water levels in rivers, lakes, and aquifers and degrading aquatic habitats.

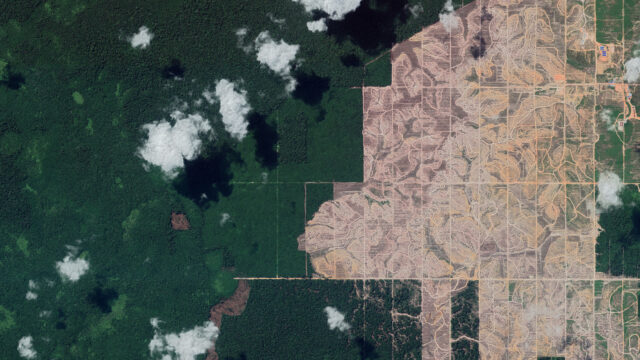
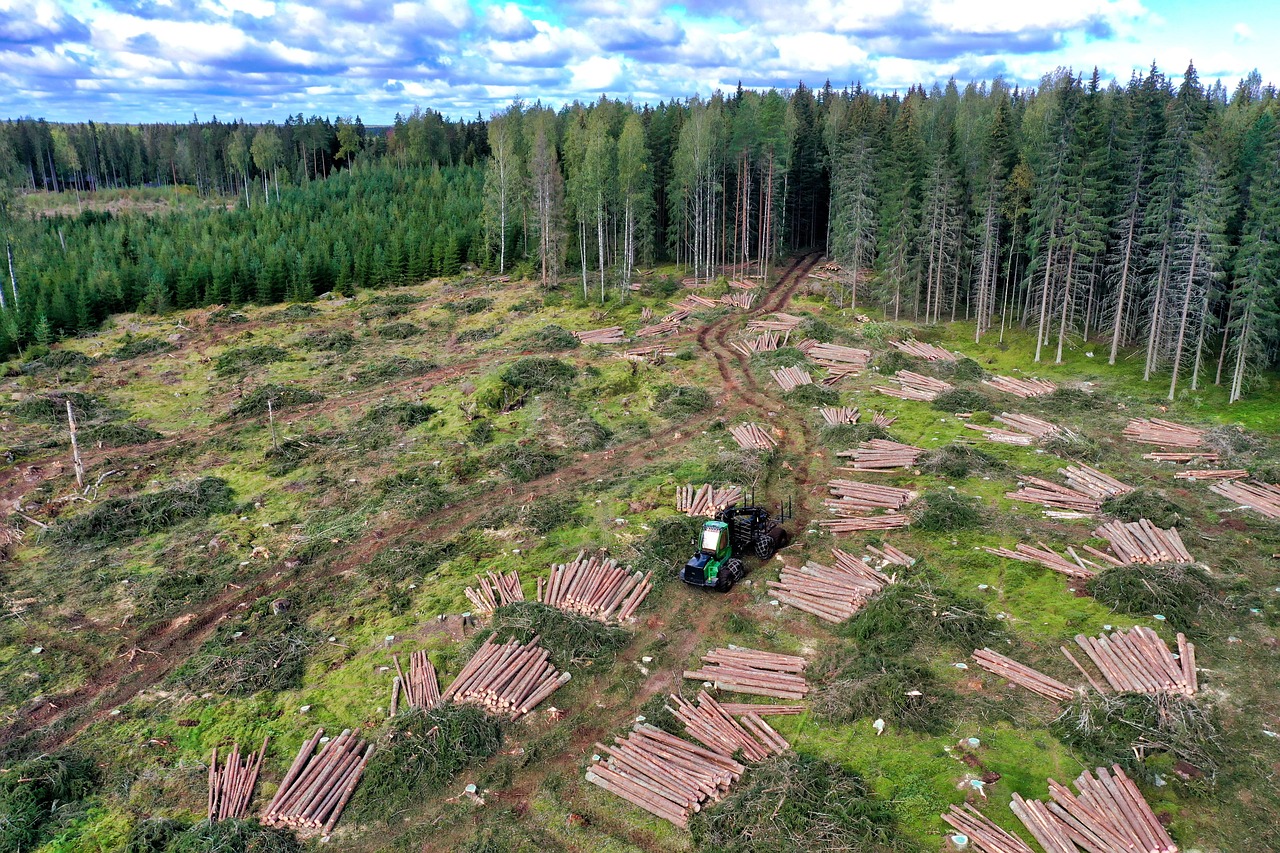
Land use and vegetation change
Deforestation, agriculture, and urban expansion have greatly changed the way land stores and moves water. When forests are cleared or soils are sealed under concrete, they lose their ability to hold green water — the moisture that plants rely on. This weakens local rainfall, increases runoff, and can intensify both floods and droughts. Changes to land systems also affect regional weather patterns, such as monsoons, and create feedback loops that further influence the climate.
Control Variables
The Planetary Boundary for Freshwater Change looks at two main parts of the global water cycle: blue water and green water. Blue water is the water we can see and use — in rivers, lakes, and underground aquifers. Green water is the moisture stored in the soil that plants rely on to grow and that helps drive rainfall through evaporation.
Both types of water are now under serious pressure. Rivers are drying up or flooding at the wrong times, Climate Change and deforestation are changing rainfall patterns, and soils are drying out and losing their ability to hold water. These disruptions make it harder for people and nature to access the water they need, and increase the risk of droughts, floods, and widespread ecosystem damage.
Blue Water
This figure shows the percentage of land area with significant alteration of blue water flows (streamflow) from 1901 to 2019 compared to the baseline state. The blue line shows the percentage of land area exhibiting local deviations in blue water (10-year moving average of streamflow deviations). The red line shows the Planetary Boundary of 12.9% land area affected, while the green line represents the baseline median of 10.3% land area. Data from Virkki et al. (2025).
Local streamflow deviations have significantly increased since the early 20th century, surpassing the Planetary Boundary around 1940 and continuing to rise since then.
Definition
Human-induced disturbance of blue water, which refers to water in rivers, lakes, reservoirs, groundwater and wetlands, is approximated by the annual global area with significant deviations in streamflow from variability under the baseline (pre-industrial-like) state. The boundary reflects changes in blue water availability, which are crucial for the health of associated aquatic and terrestrial ecosystems.
Unit
Percentage (%) of annual global ice-free land area
Historical Range
The percentage of land area experiencing significant deviations in streamflow can range from 0% (no area affected) to 100% (all ice-free land area affected), with a baseline median value of about 10.3%. The baseline conditions reflect a hypothetical unaffected Earth system state, based on a 119-year long pre-industrial-like scenario with no climate change and with human forcing (land and water use) at year 1901 levels.
Planetary Boundary (PB)
The PB is set at 12.9% of the global ice-free land area experiencing strong wet or dry deviations in streamflow. This corresponds to the 95th percentile of the baseline state variability, during which anomalously dry or wet local conditions occurred annually with a likelihood of less than 5% on at least 12.9% of the global area.
Green Water
This figure shows the percentage of land area with significant alteration of green water flows (soil moisture) from 1901 to 2019 compared to the baseline state. The blue line shows the percentage of land area exhibiting local deviations in green water (10-year moving average of soil moisture). The red line shows the PB of 12.4% land area affected, while the green line represents the baseline median of 9.8%. Data from Virkki et al. (2025).
Local soil moisture deviations have significantly increased since the early 20th century, surpassing the PB around 1940 and continuing to rise since then.
Definition
Human-induced disturbance of green water, which refers to the stock of soil moisture available to plants, is approximated by the annual global area with significant deviations in root zone soil moisture from variability under the baseline (pre-industrial-like) state. The boundary reflects changes in green water availability, impacting terrestrial ecosystems, climate regulation, and biogeochemical processes.
Unit
Percentage (%) of annual global ice-free land area
Historical Range
The percentage of land area experiencing significant deviations in soil moisture can range from 0% (no area affected) to 100% (all ice-free land area affected), with a baseline median value of about 9.8%. The baseline conditions reflect a hypothetical unaffected Earth system state, based on a 119-year long pre-industrial-like scenario with no climate change and with human forcing (land and water use) at year 1901 levels.
Planetary Boundary (PB)
The PB is set at 12.4% of the global ice-free land area experiencing strong wet or dry deviations in soil moisture. This corresponds to the 95th percentile of baseline state variability, during which anomalously dry or wet local conditions occurred annually with a likelihood of less than 5% on at least 12.4% of the global area.