Climate Change
Climate change is driven by human activities that disrupt Earth's energy balance, primarily through greenhouse gas emissions.
Current State
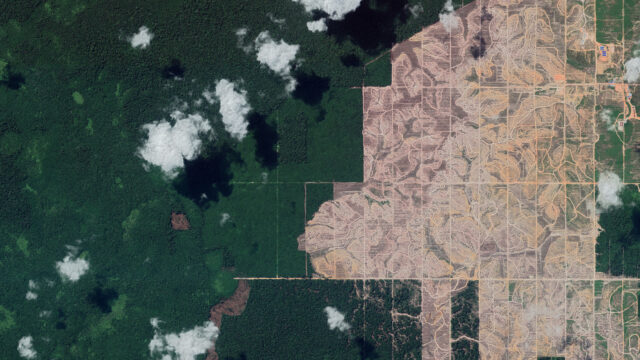
Climate change is disrupting the Earth’s climate system in ways that threaten the foundations of human wellbeing. By burning fossil fuels, clearing forests, and altering the land, humanity is releasing large amounts of greenhouse gases that trap extra heat in the atmosphere. This is pushing the planet beyond its natural limits. As a result, global temperatures are increasing, ice sheets are melting, and weather patterns are becoming more extreme. Sea levels are rising, and ecosystems are under stress.
These changes increase the risk of crossing dangerous tipping points – irreversible shifts in Earth’s systems that could lock in long-term damage. Communities around the world are already experiencing more heatwaves, droughts, floods, and storms. Without urgent action, continued climate disruption risks triggering irreversible changes in Earth’s systems, undermining ecosystems, human health, and societal stability for generations to come.
Global patterns of fossil CO₂ emissions
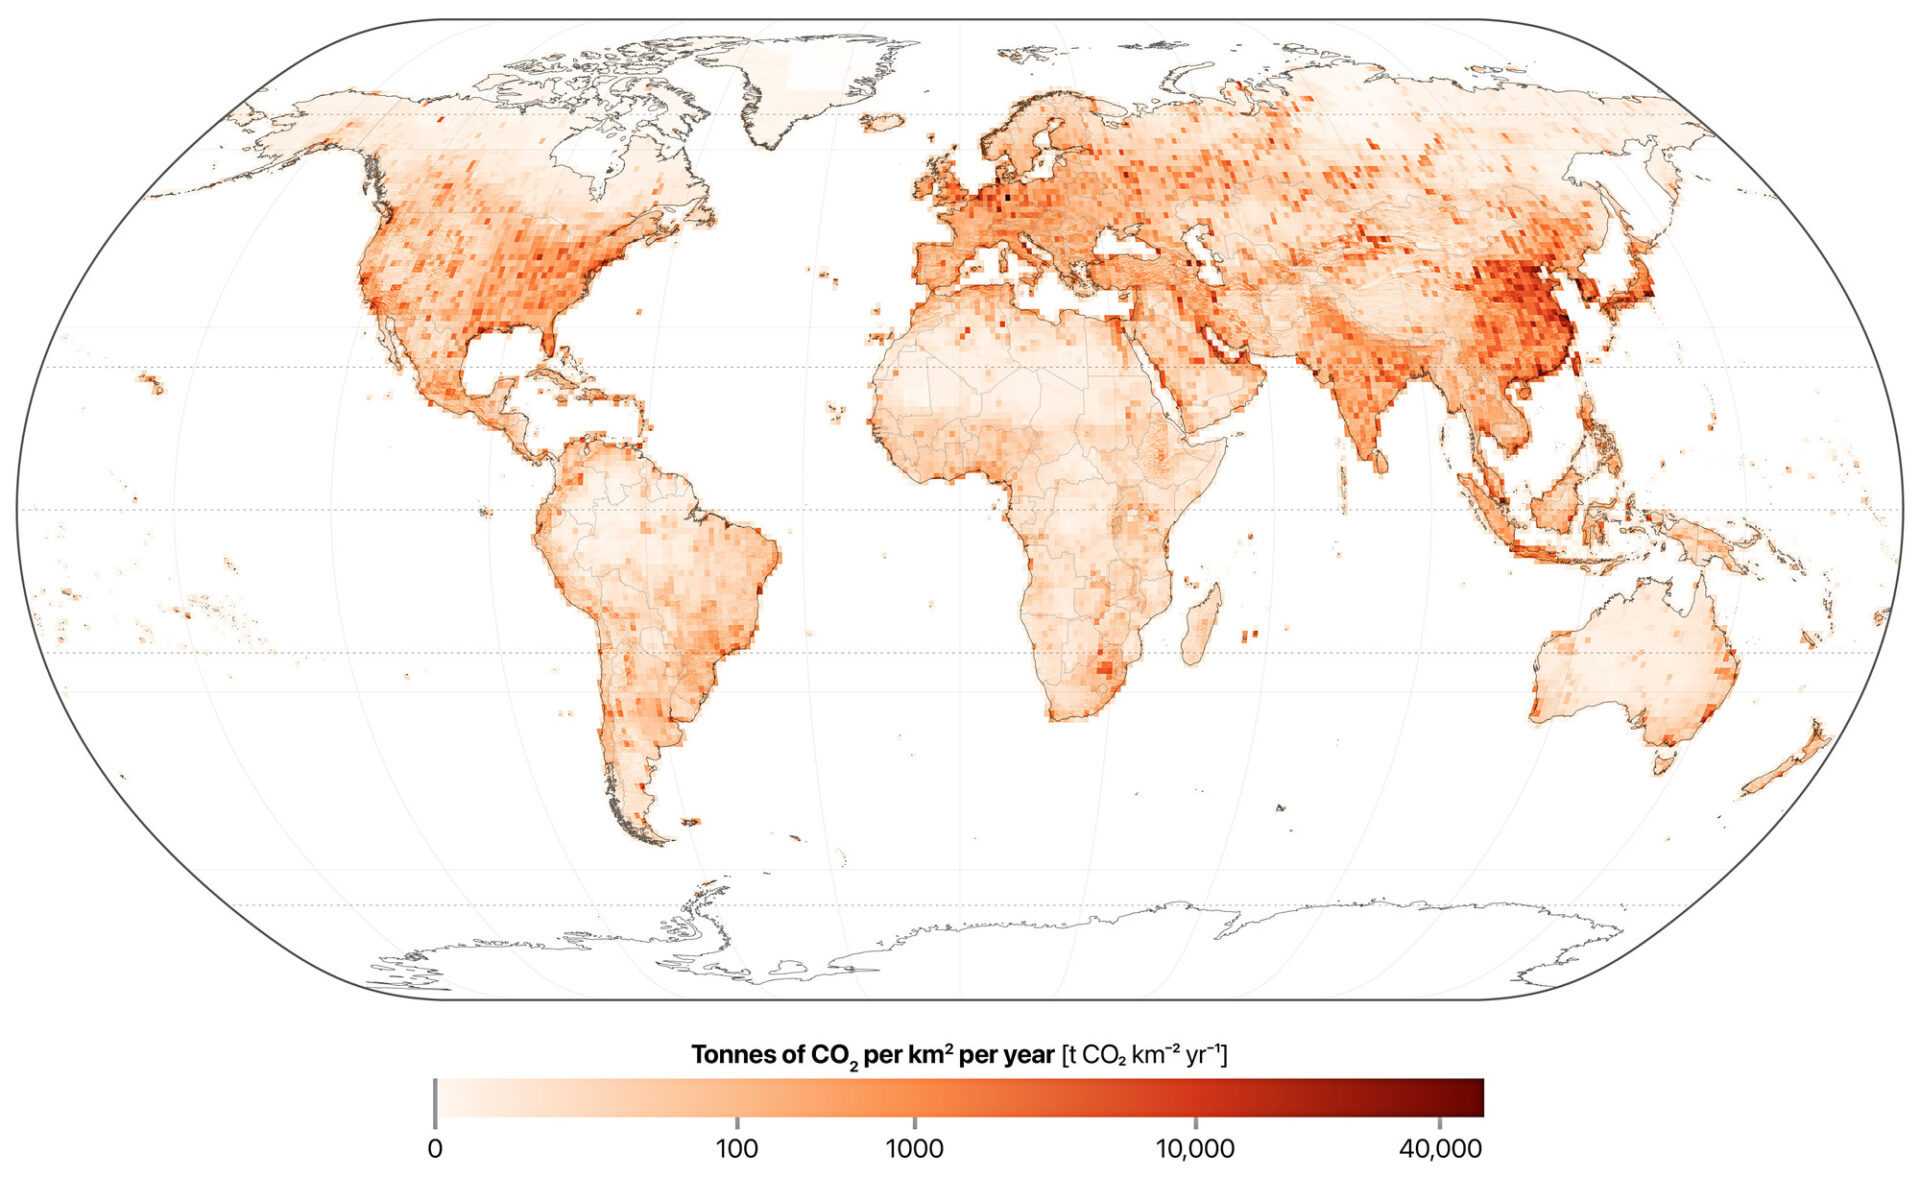
Where climate change begins: This map shows fossil CO₂ emissions intensity in 2024, expressed as tonnes of CO₂ per square kilometer per year. This data from Climate TRACE combines satellite observations with AI models to measure emissions from thousands of individual facilities worldwide. Fossil CO₂ emissions are highly uneven across the globe – concentrated in heavily populated areas, with further hotspots such as industrial operations, resource extraction, and fires.
Impacts
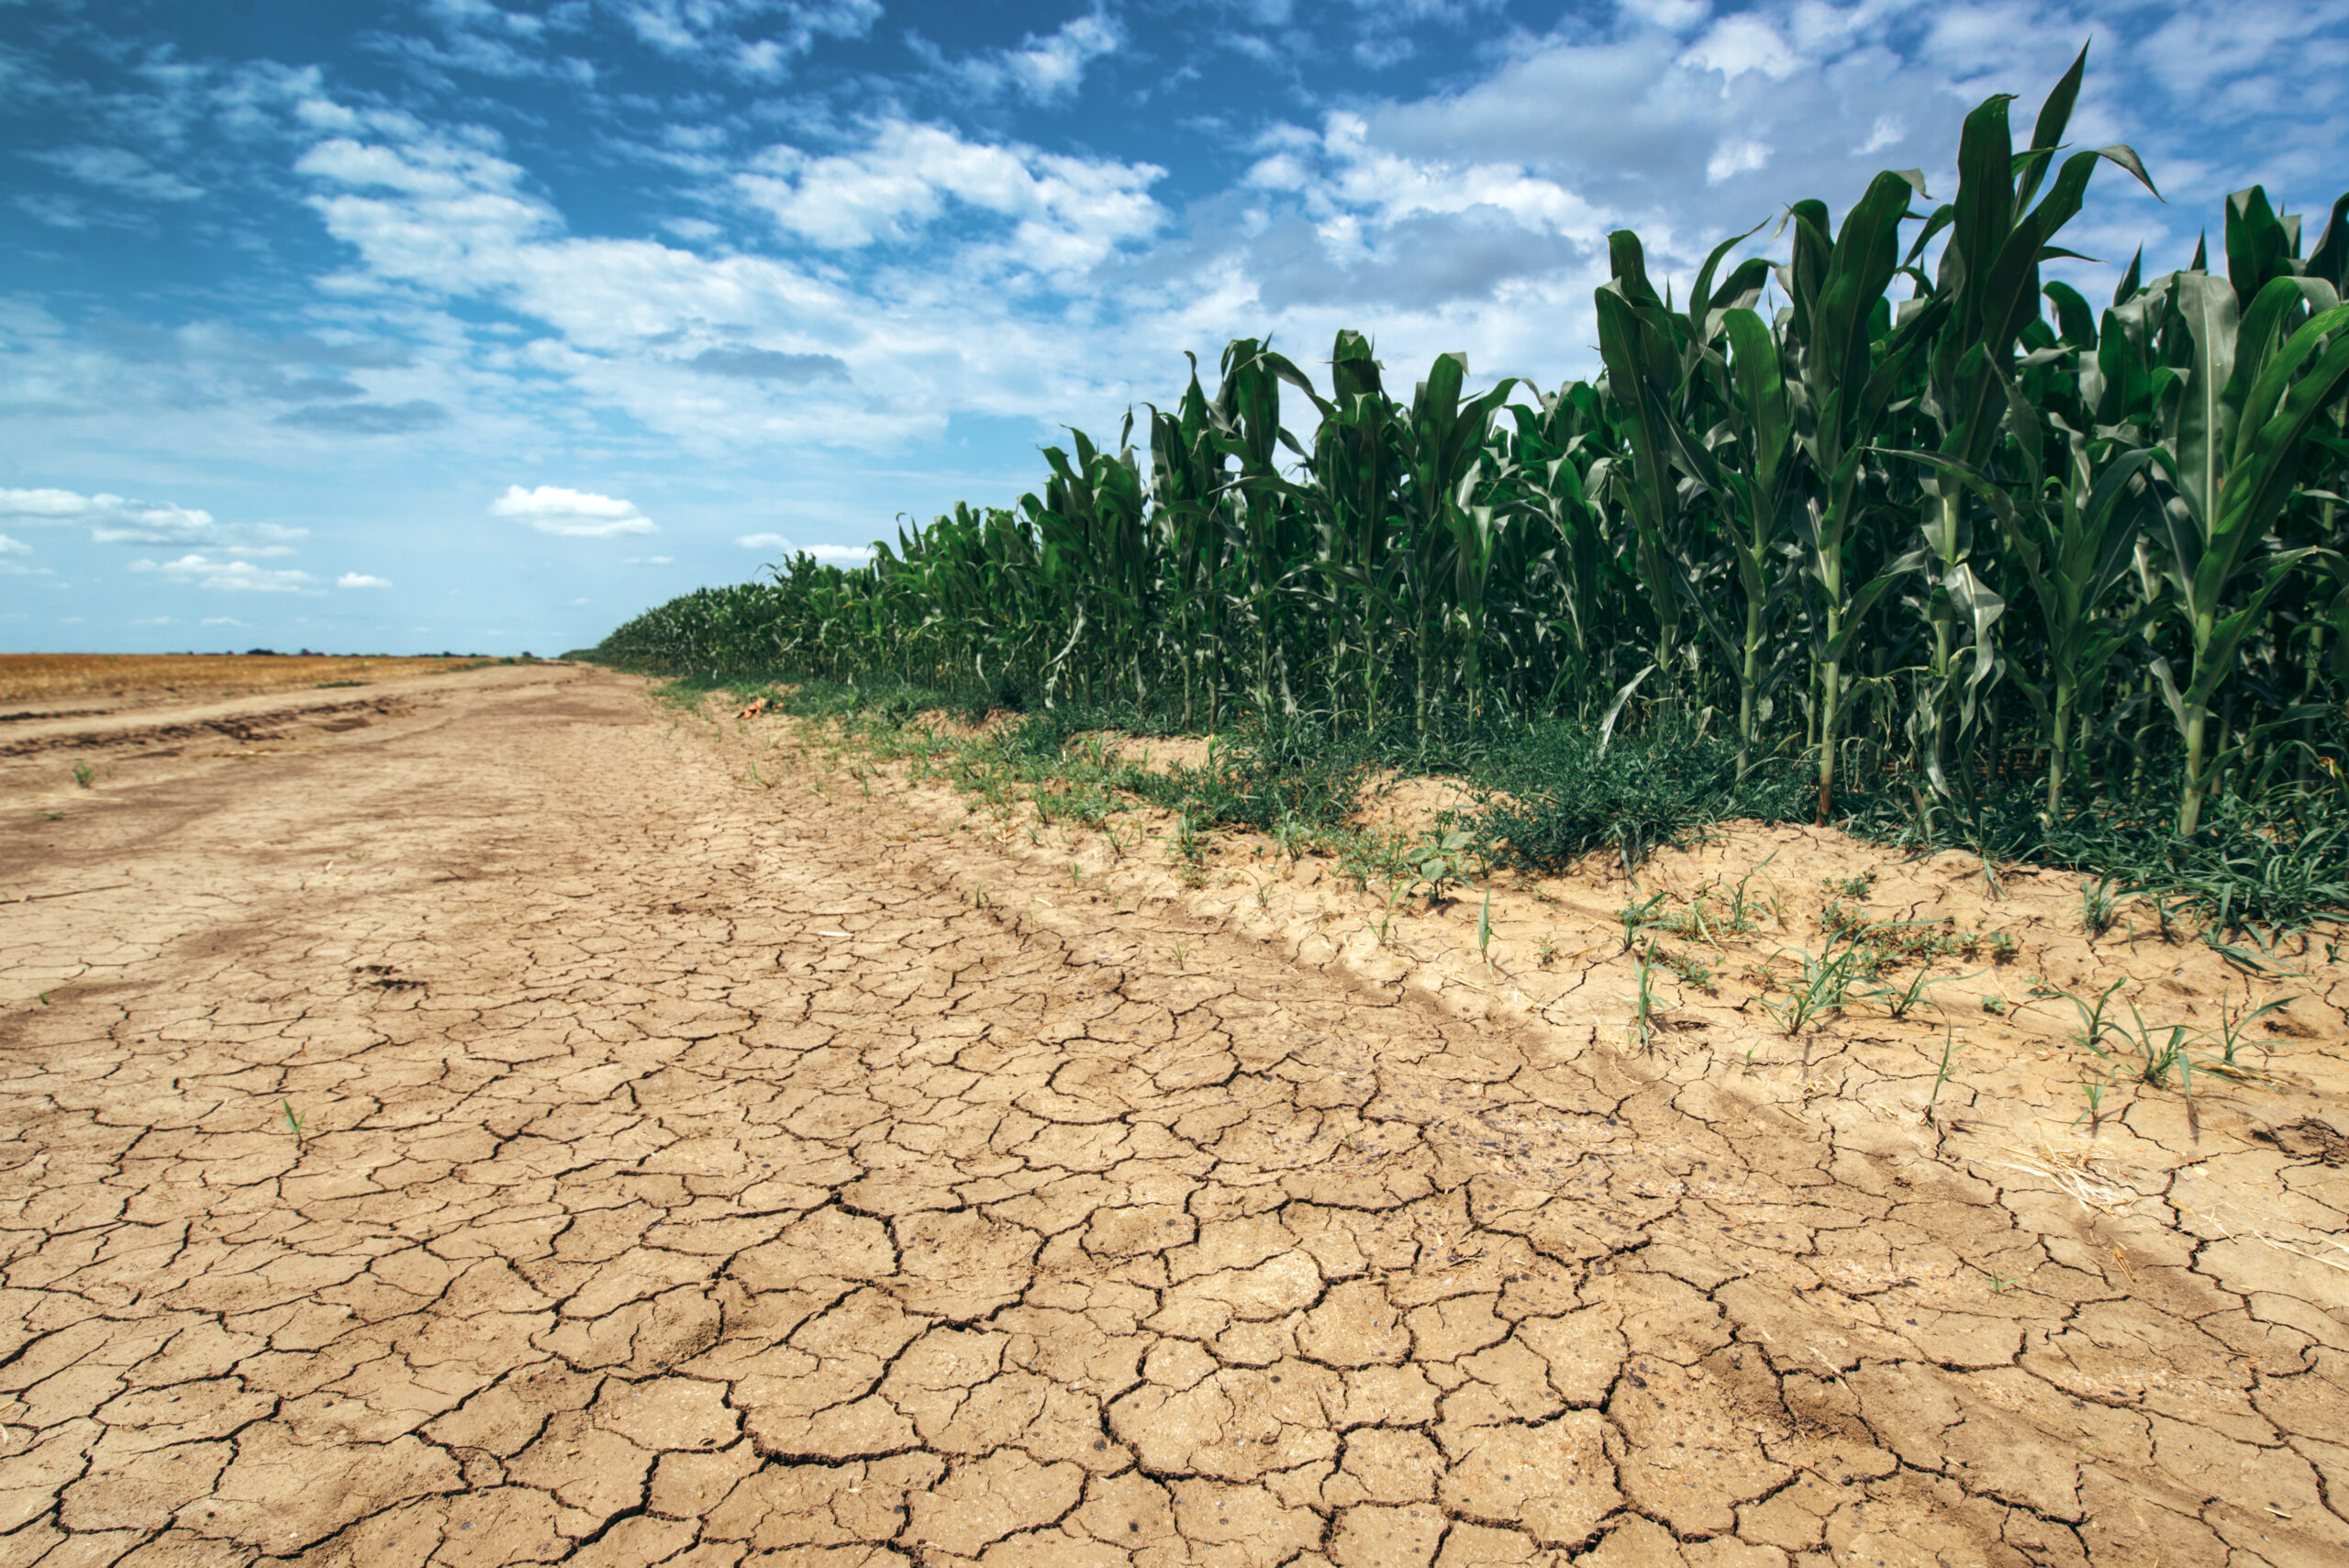
As more heat is trapped in the Earth system, temperatures rise in the atmosphere, oceans, and on land. This leads to more extreme weather, including heatwaves, floods, droughts, and heavy rainfall. Human-driven climate change now far exceeds natural variability.
Because climate change strongly influences all other Planetary Boundaries, crossing this threshold puts the entire Earth system at risk. Staying beyond the safe zone increases the chance of irreversible changes that could affect life on Earth for generations to come.
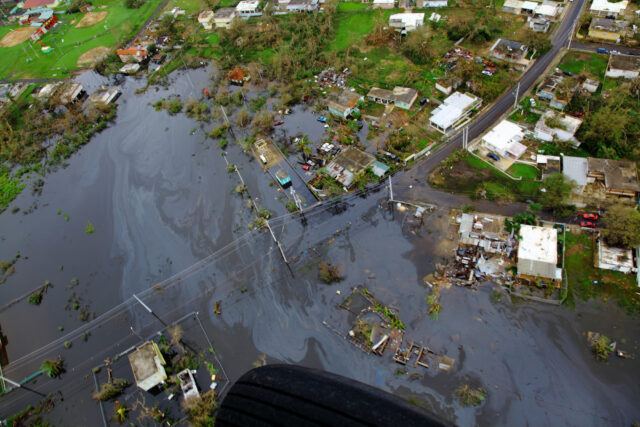
Torrential rainfall and flooding
Extreme precipitation events are becoming more frequent and intense, causing flash floods, infrastructure damage, and disrupting transportation systems across urban and rural areas.
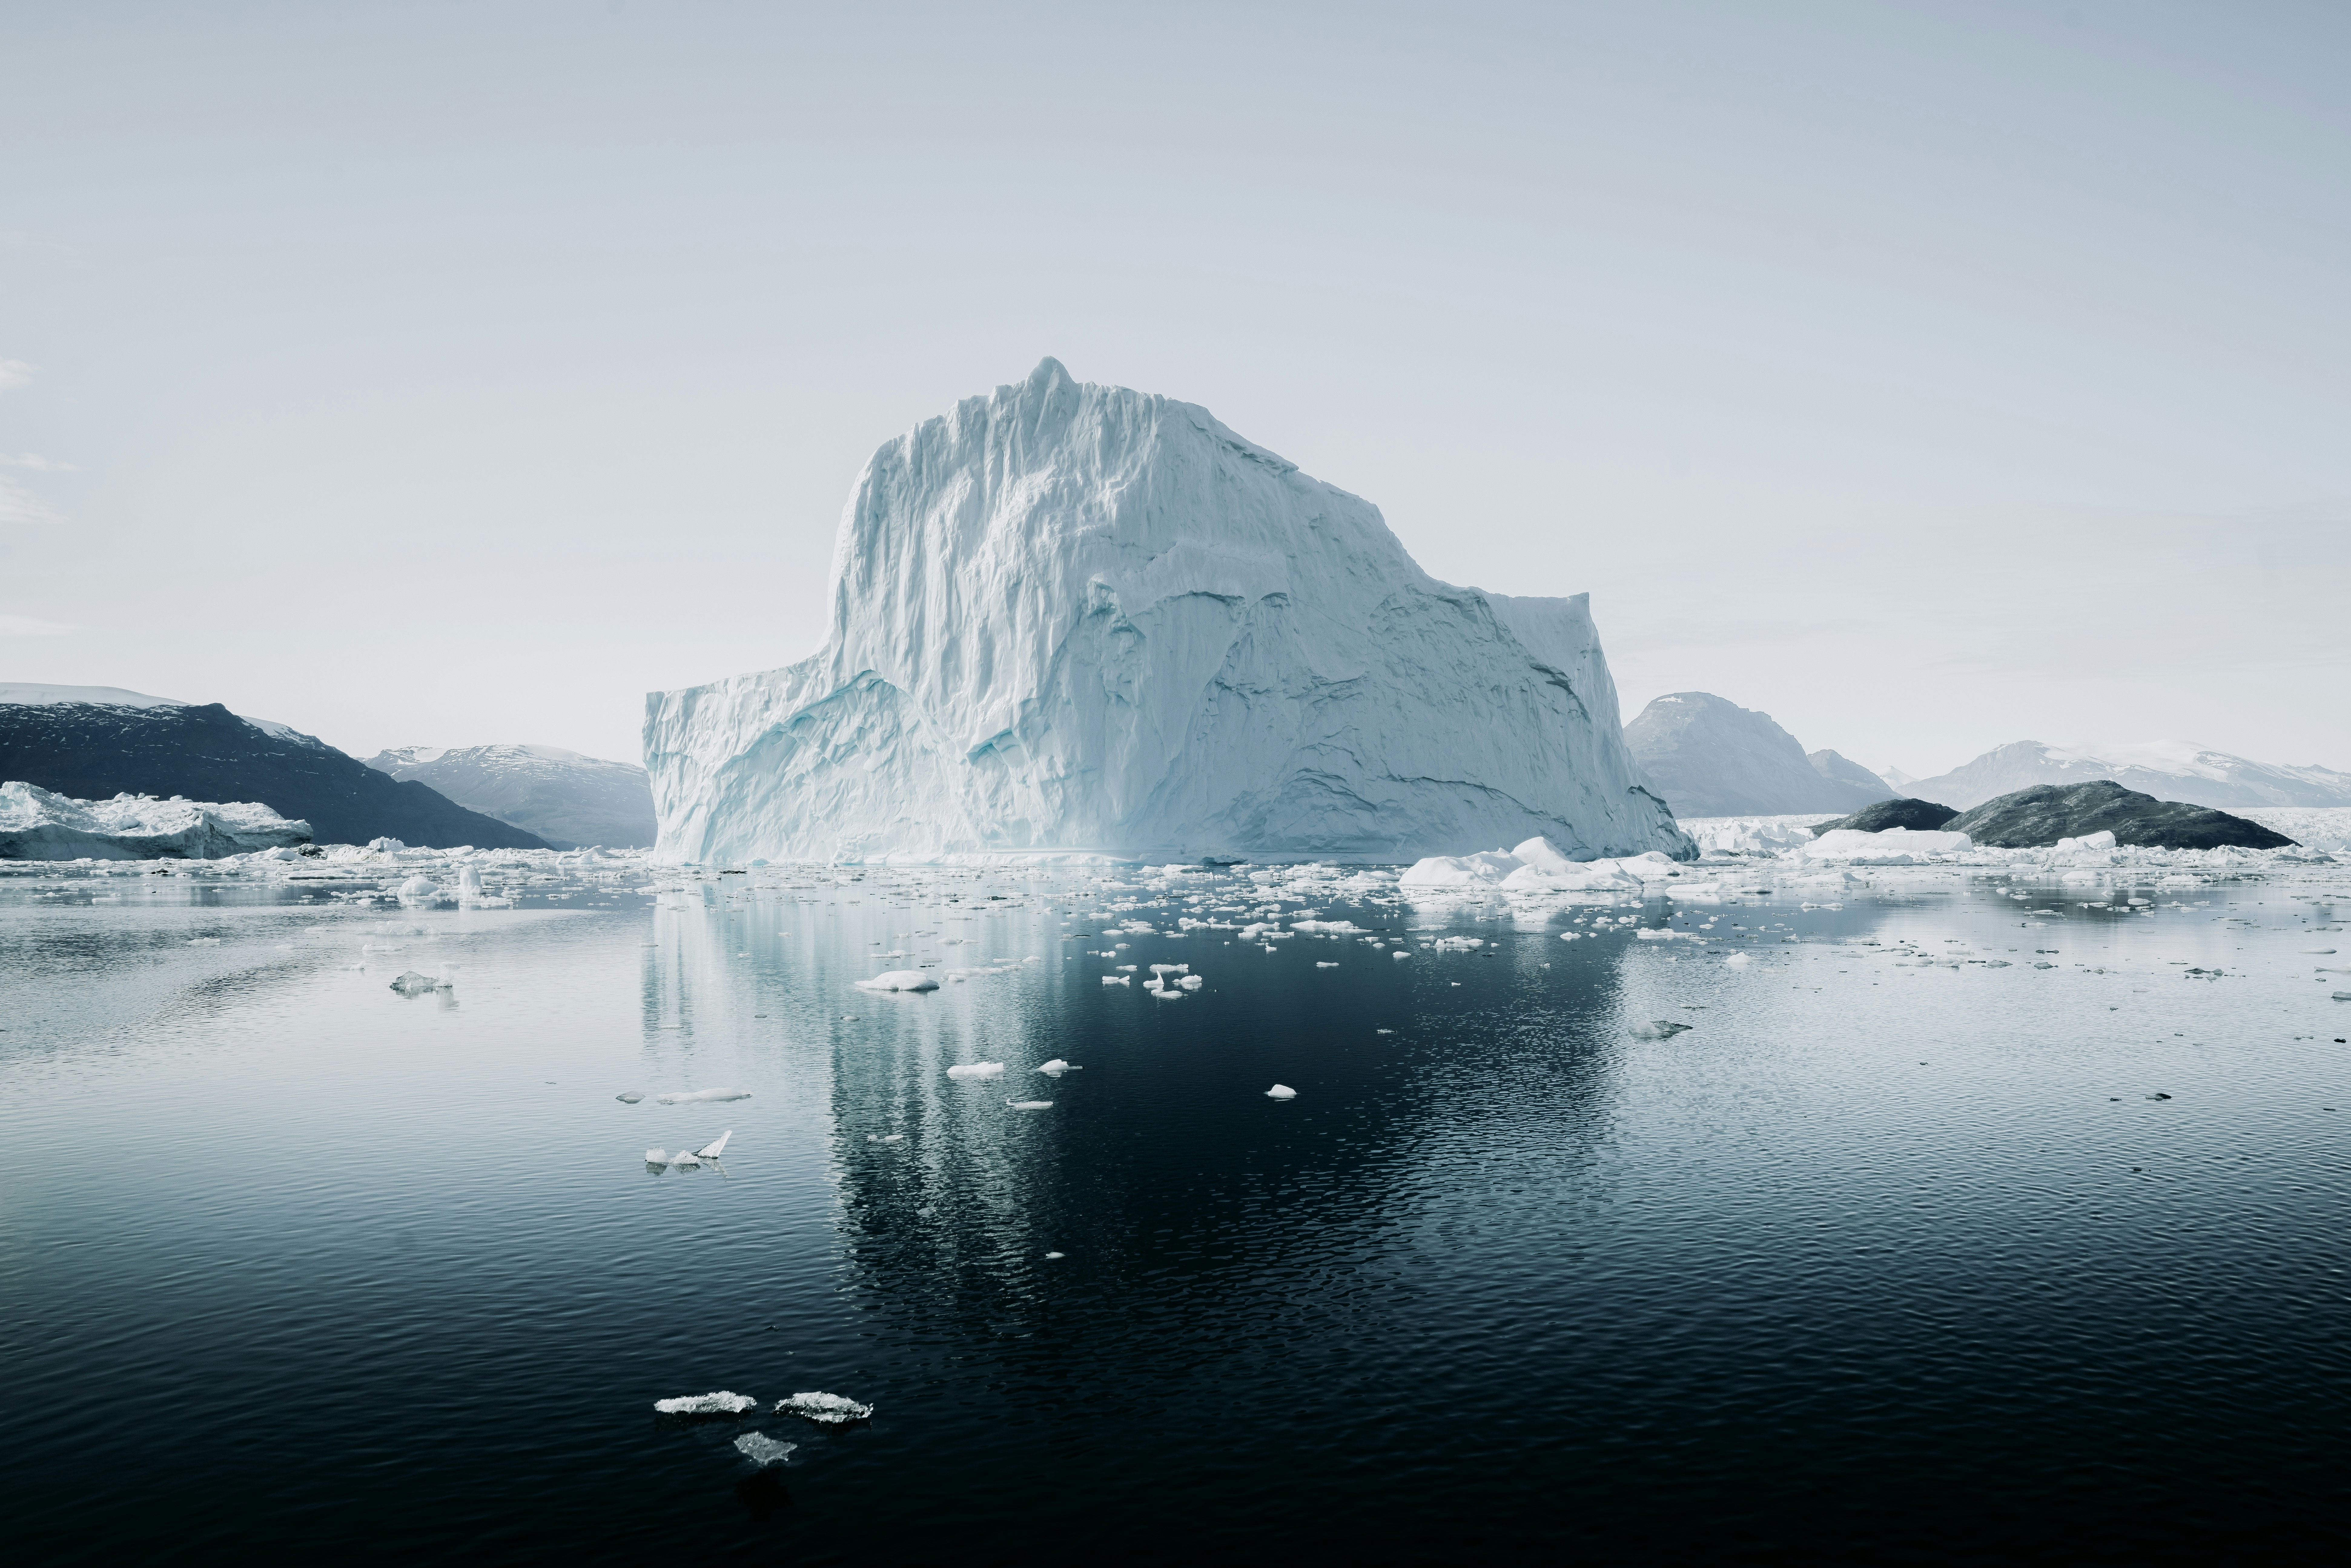
Sea level rise
Rising water levels threaten communities worldwide, displacing millions of people.

Heatwaves
Heatwaves are putting ecosystems under much strain, both in the ocean and on land. Record-breaking temperatures also stress human health and strain energy systems.

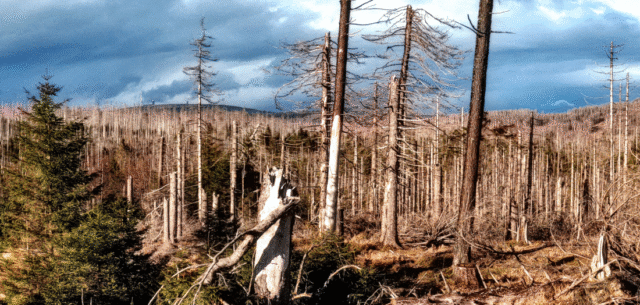
Wildfires
Increasingly severe fire seasons threaten wildlife and destroy vast forest areas, in turn producing significant CO₂ emissions.


Hindou Oumarou Ibrahim OBE Chair of the UN Permanent Forum on Indigenous Issues, President of AFPAT, Planetary Guardian
“The Guardians are grounded in the wisdom of the planet, of science, and of Indigenous people from all over the world. We need to move from climate justice to planetary justice. From simply talking to driving collective action.”
Hindou Oumarou Ibrahim OBE Chair of the UN Permanent Forum on Indigenous Issues, President of AFPAT, Planetary Guardian
Key Drivers
Fossil fuel burning
Fossil fuel burning directly increases CO2 concentration, which subsequently affects the amount of heat trapped by Earth’s atmosphere.

Other Greenhouse Gas Emissions
A second pathway involves non-CO2 greenhouse gas emissions, aerosols from sources such as agriculture, and changes in albedo (the refelctivity of the Earth’s surface) resulting from land-use changes and natural ecosystem degradation. Aerosols and land-use changes exemplify how the Climate Change boundary is closely linked to other Planetary Boundaries. Changes in any environmental domain can impact Climate Change, highlighting the interconnected nature of the Planetary Boundary processes.

Control Variables
In the Planetary Boundaries Framework, Climate Change is measured using two variables: The concentration of CO₂ in the atmosphere, and the extra amount of the sun’s heat that is trapped because of human activities. Both variables have exceeded their safe thresholds.
Atmospheric CO₂ Concentration (CO₂)
This figure illustrates the steady increase in the atmospheric CO₂ concentration, as one of the Climate Change boundary’s control variables. The dark blue line represents annual mean values from 1959 to 2024 at the Mauna Loa Observatory in Hawaii, operated by the National Oceanic and Atmospheric Administration (NOAA). The light blue line shows globally averaged CO₂ concentrations from multiple international monitoring sites, including Mauna Loa. The green and red lines indicate the baseline (safe) value (280 ppm) and the Planetary Boundary threshold (350 ppm) for this control variable, respectively.
CO₂ continues to rise and remains the dominant driver of climate change, with current levels approximately 50% above pre-industrial concentrations.
Definition
Atmospheric CO₂ is a primary greenhouse gas emitted by human activities such as fossil fuel combustion, deforestation, and cement production. It is a key driver of Climate Change. CO₂ is relatively straightforward to monitor through atmospheric measurements, satellite observations, and carbon budget assessments.
Unit
Parts per million (ppm)
Historical Range
Over the course of Earth’s history, CO₂ levels have naturally fluctuated between about 180–200 ppm during ice ages and around 280 ppm during the pre-industrial Holocene period.
Planetary Boundary (PB)
Scientists have proposed a PB for CO₂ at 350 ppm, based on paleoclimate evidence and climate modeling. This threshold represents a point beyond which the risks of triggering irreversible changes, such as large-scale melting of polar ice sheets, increase significantly. It also aligns with the internationally recognized goal of limiting global warming to 1.5 °C above pre-industrial levels, as agreed upon in the Paris Climate Agreement.
Total Anthropogenic Radiative Forcing at the Top of the Atmosphere (TOA)
This figure shows the global average of human-induced radiative forcing at the top of the atmosphere from 1750 to 2024. The values were calculated using observational data and established climate models, based on methods from the IPCC. The green line marks the safe baseline (0.0 W/m²), and the red line indicates the Planetary Boundary (+1.0 W/m²).
Human activities have disturbed our planet’s energy balance to three times the safe limit, exerting a persistent warming influence on the Earth system and pushing well beyond the safe threshold.
Definition
The net radiative forcing sums up all the ways human activities impact the global climate. This includes emissions of greenhouse gases such as carbon dioxide (CO₂), methane (CH₄), and nitrous oxide (N₂O), as well as aerosols and land-use changes. Radiative forcing is a key measure of how much additional heat energy is added to the Earth system. It integrates the effects of all human activities that influence the planet’s energy balance and therefore represents the overall strength of human-induced climate change. While direct TOA fluxes can be measured via satellites, estimating the human-caused component depends on climate models. This makes it a powerful, system-level signal, but also more abstract and less directly observable than CO₂ or temperature.
Unit
Watts per square meter (W/m²)
Historical Range
During the pre-industrial Holocene, the radiative forcing remained relatively stable with small fluctuations due to land cover changes and volcanic activity, indicating a stable energy balance under which human civilizations developed. Significant positive forcing began with the Industrial Revolution, as greenhouse gas concentrations rose due to fossil fuel combustion and land conversion.
Planetary Boundary (PB)
Scientists have proposed a PB for total anthropogenic radiative forcing at +1.0 W/m², relative to pre-industrial levels. This threshold is based on the climate system’s sensitivity to greenhouse gas forcing, observed responses of polar ice sheets to warming, and growing evidence of climate instability at forcing levels above +1.5 W/m². Exceeding this boundary increases the risk of irreversible climate impacts and long-term system feedback loops.
Learn More
Tipping Points
Fragile regional systems with global consequences.

A Safe Operating Space for Humanity
Respecting Planetary Boundaries to maintain our Planet's vital functions.