Downloads
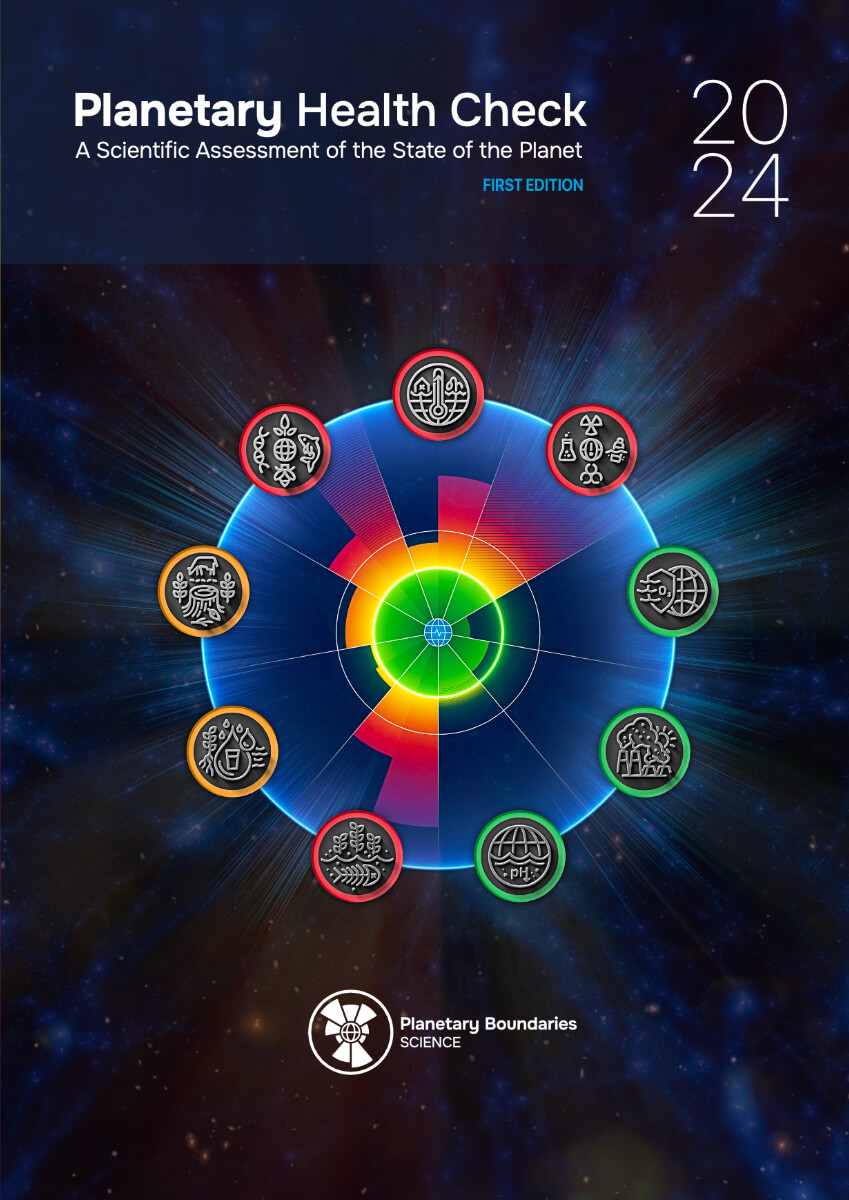
Planetary Health Check 2024
A Scientific Assessment of the State of the Planet
This inaugural annual report represents a crucial step in monitoring and safeguarding Earth's stability, resilience, and life-support functions — what we refer to as "Planetary Health".
Download
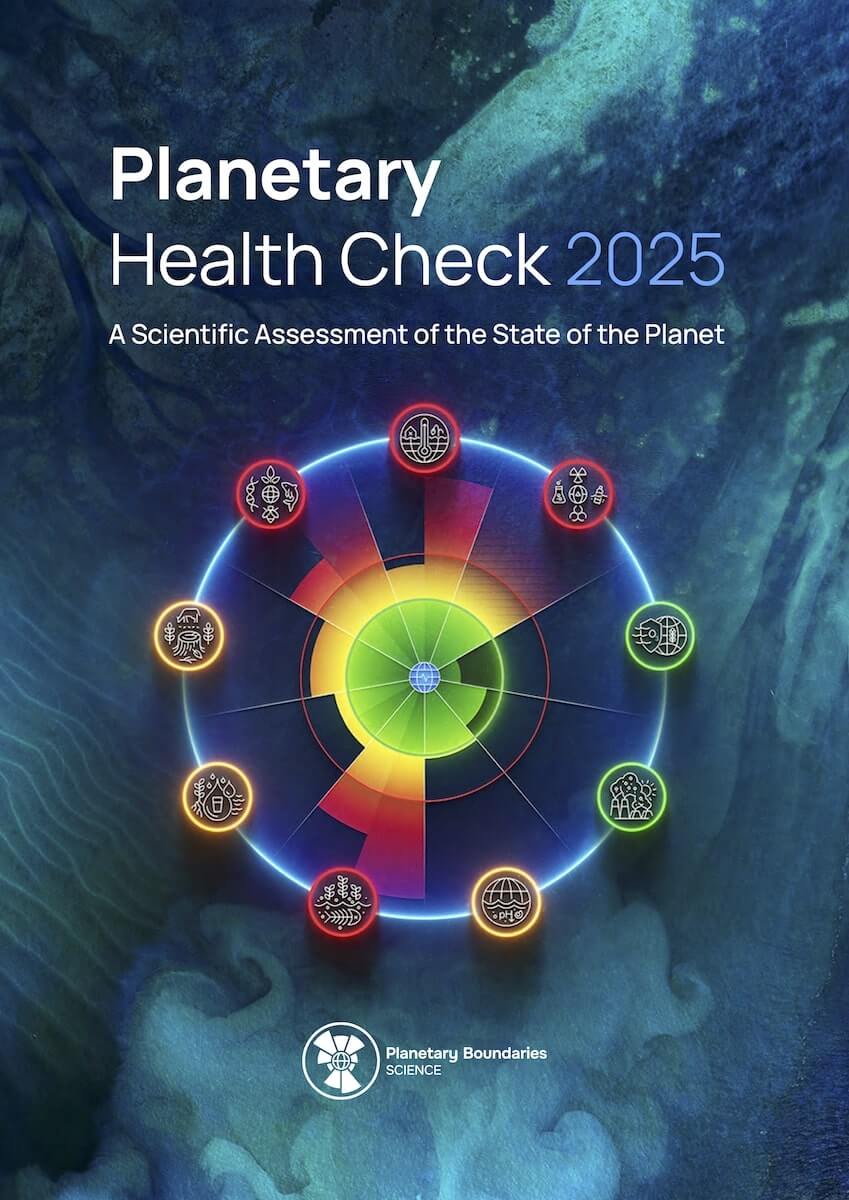
Planetary Health Check 2025
A Scientific Assessment of the State of the Planet
The latest assessment of Planetary Boundaries science is contained in the inaugural Planetary Health Check report, developed by the Potsdam Institute
for Climate Impact Research.
Additional bulk download options of figures are vailable from the PBscience Lab's official website.
Download
All Downloads
Filter by Languages
Filter by Year
Filter by Type
Planetare Belastungsgrenzen kurz und knapp
Ein zweiseitiger Flyer, der die planetaren Belastungsgrenzen in vereinfachter Sprache erklärt.
A Rough Guide to Planetary Boundaries
A two-pager explaining the Planetary Boundaries in simplified language
FIGURE 45 – From conception to contamination: The rise of novel entities
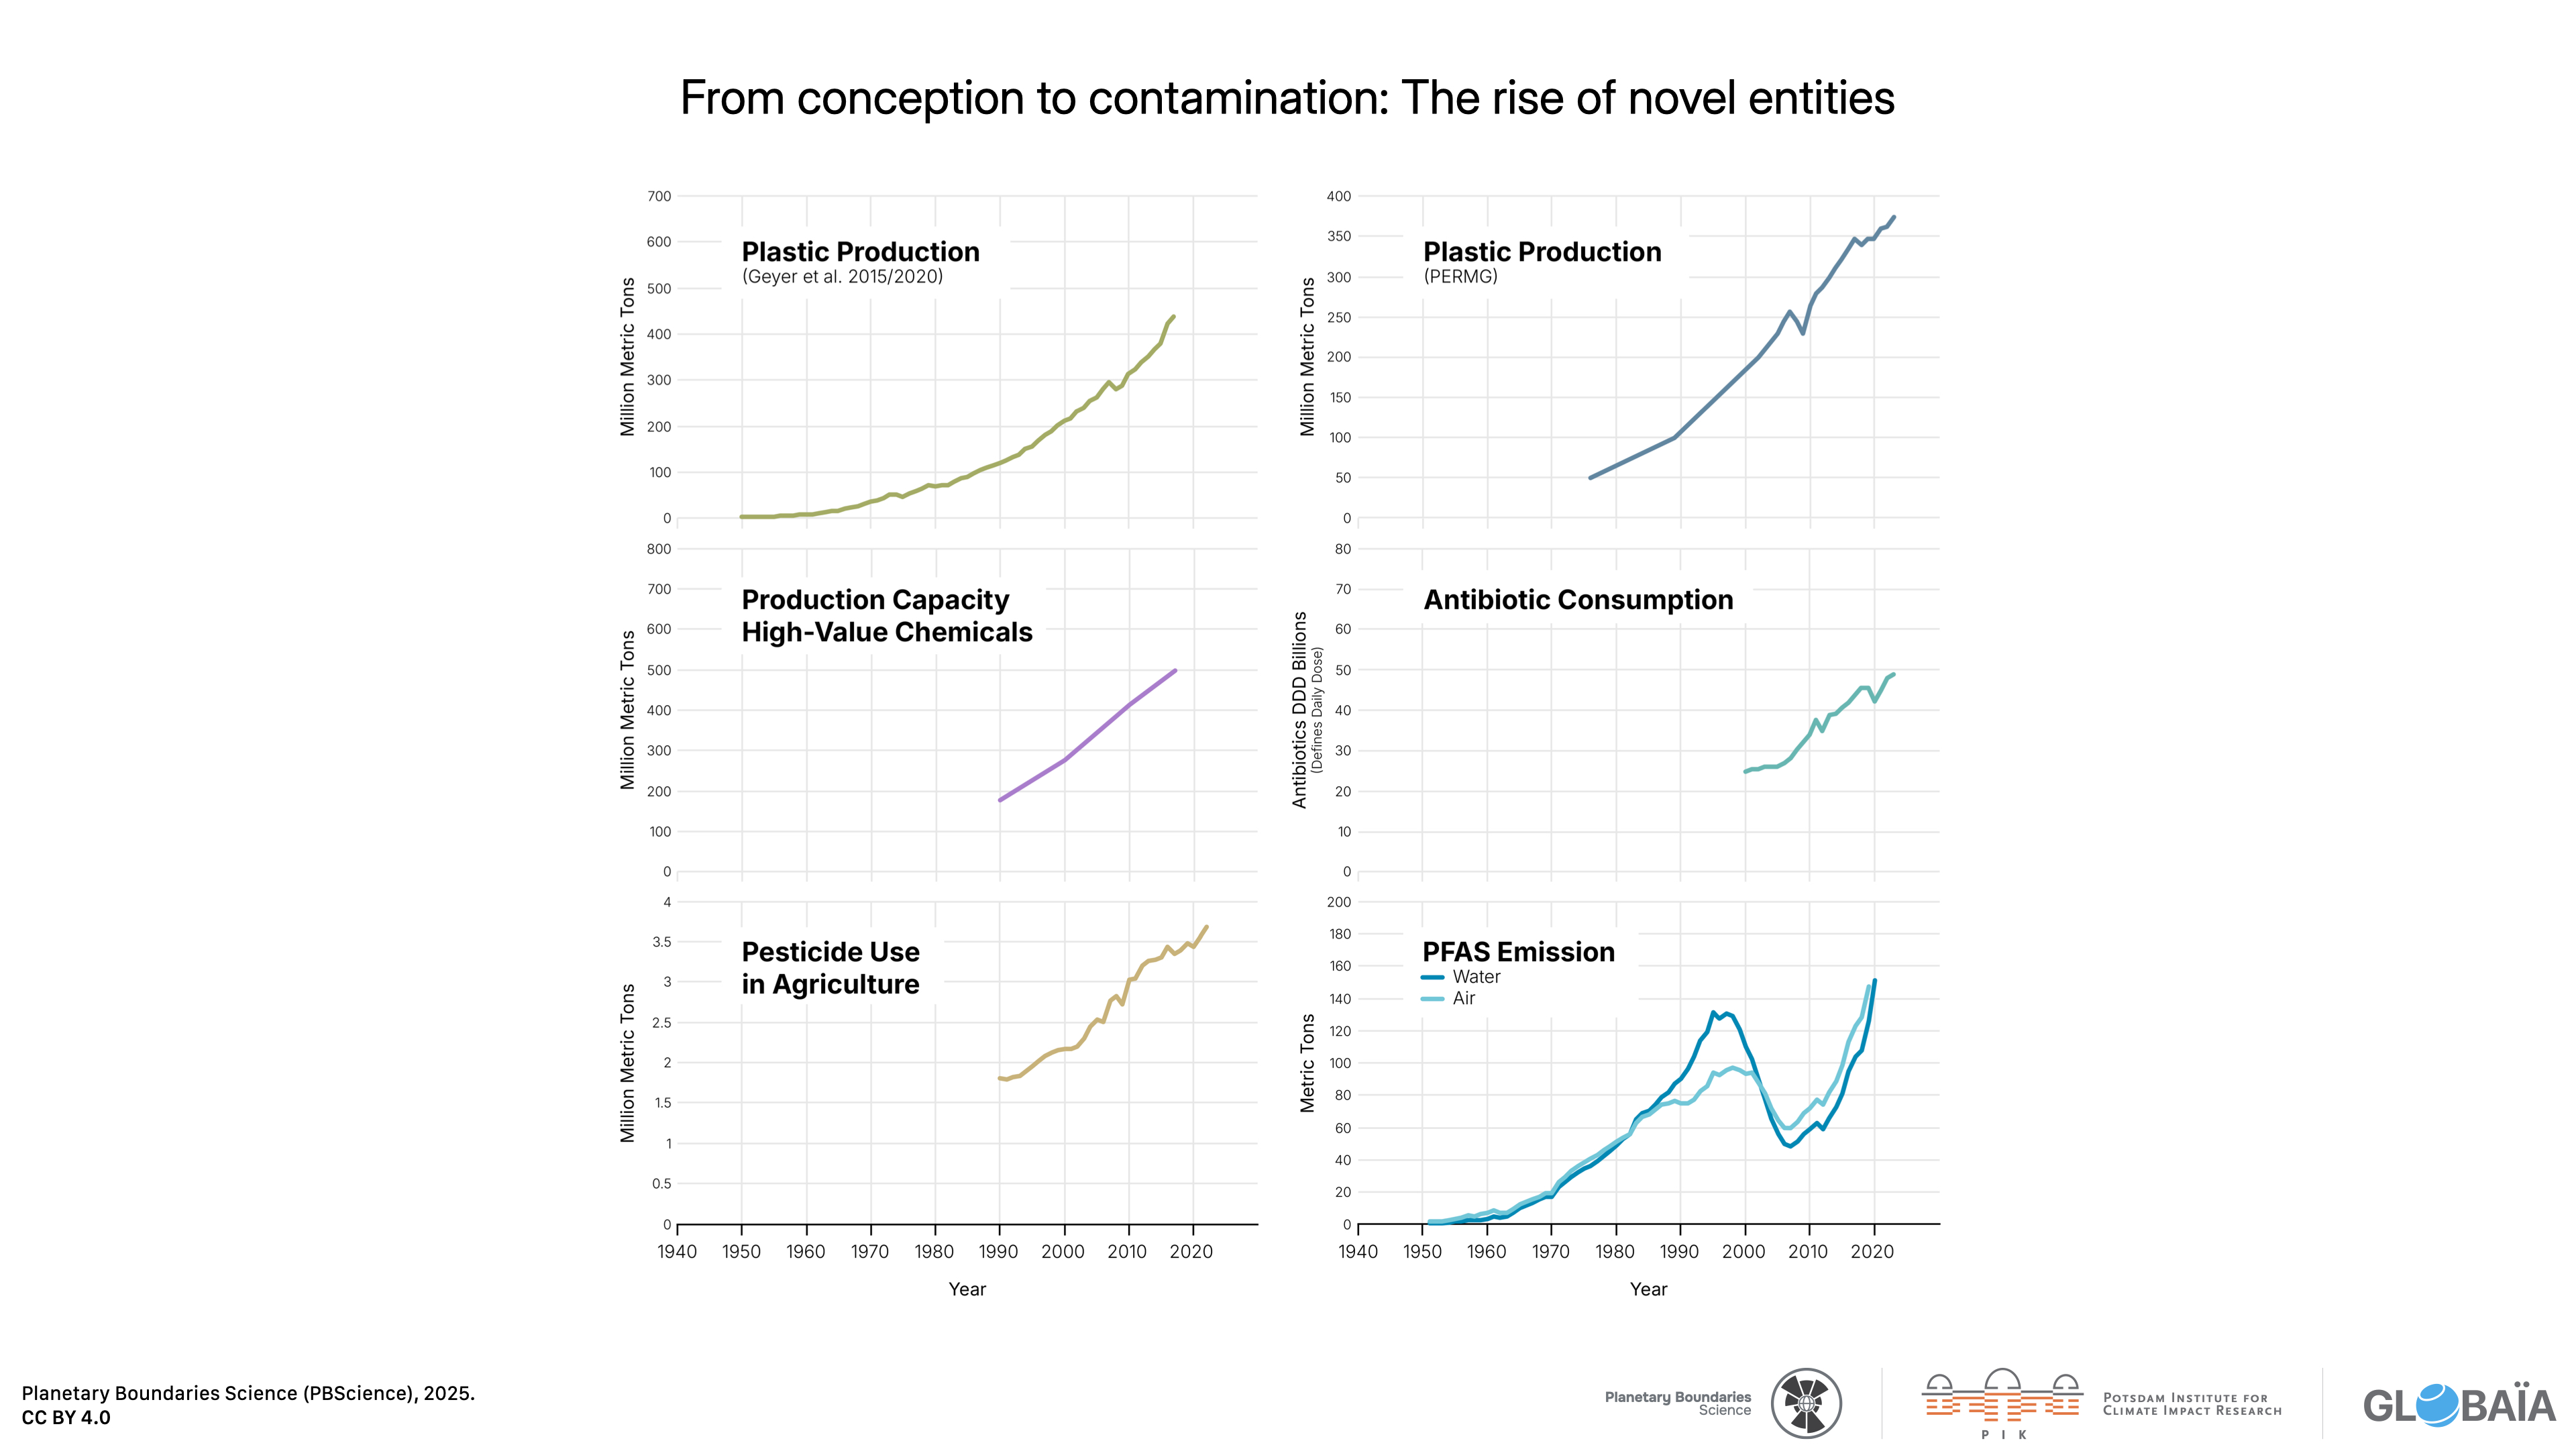

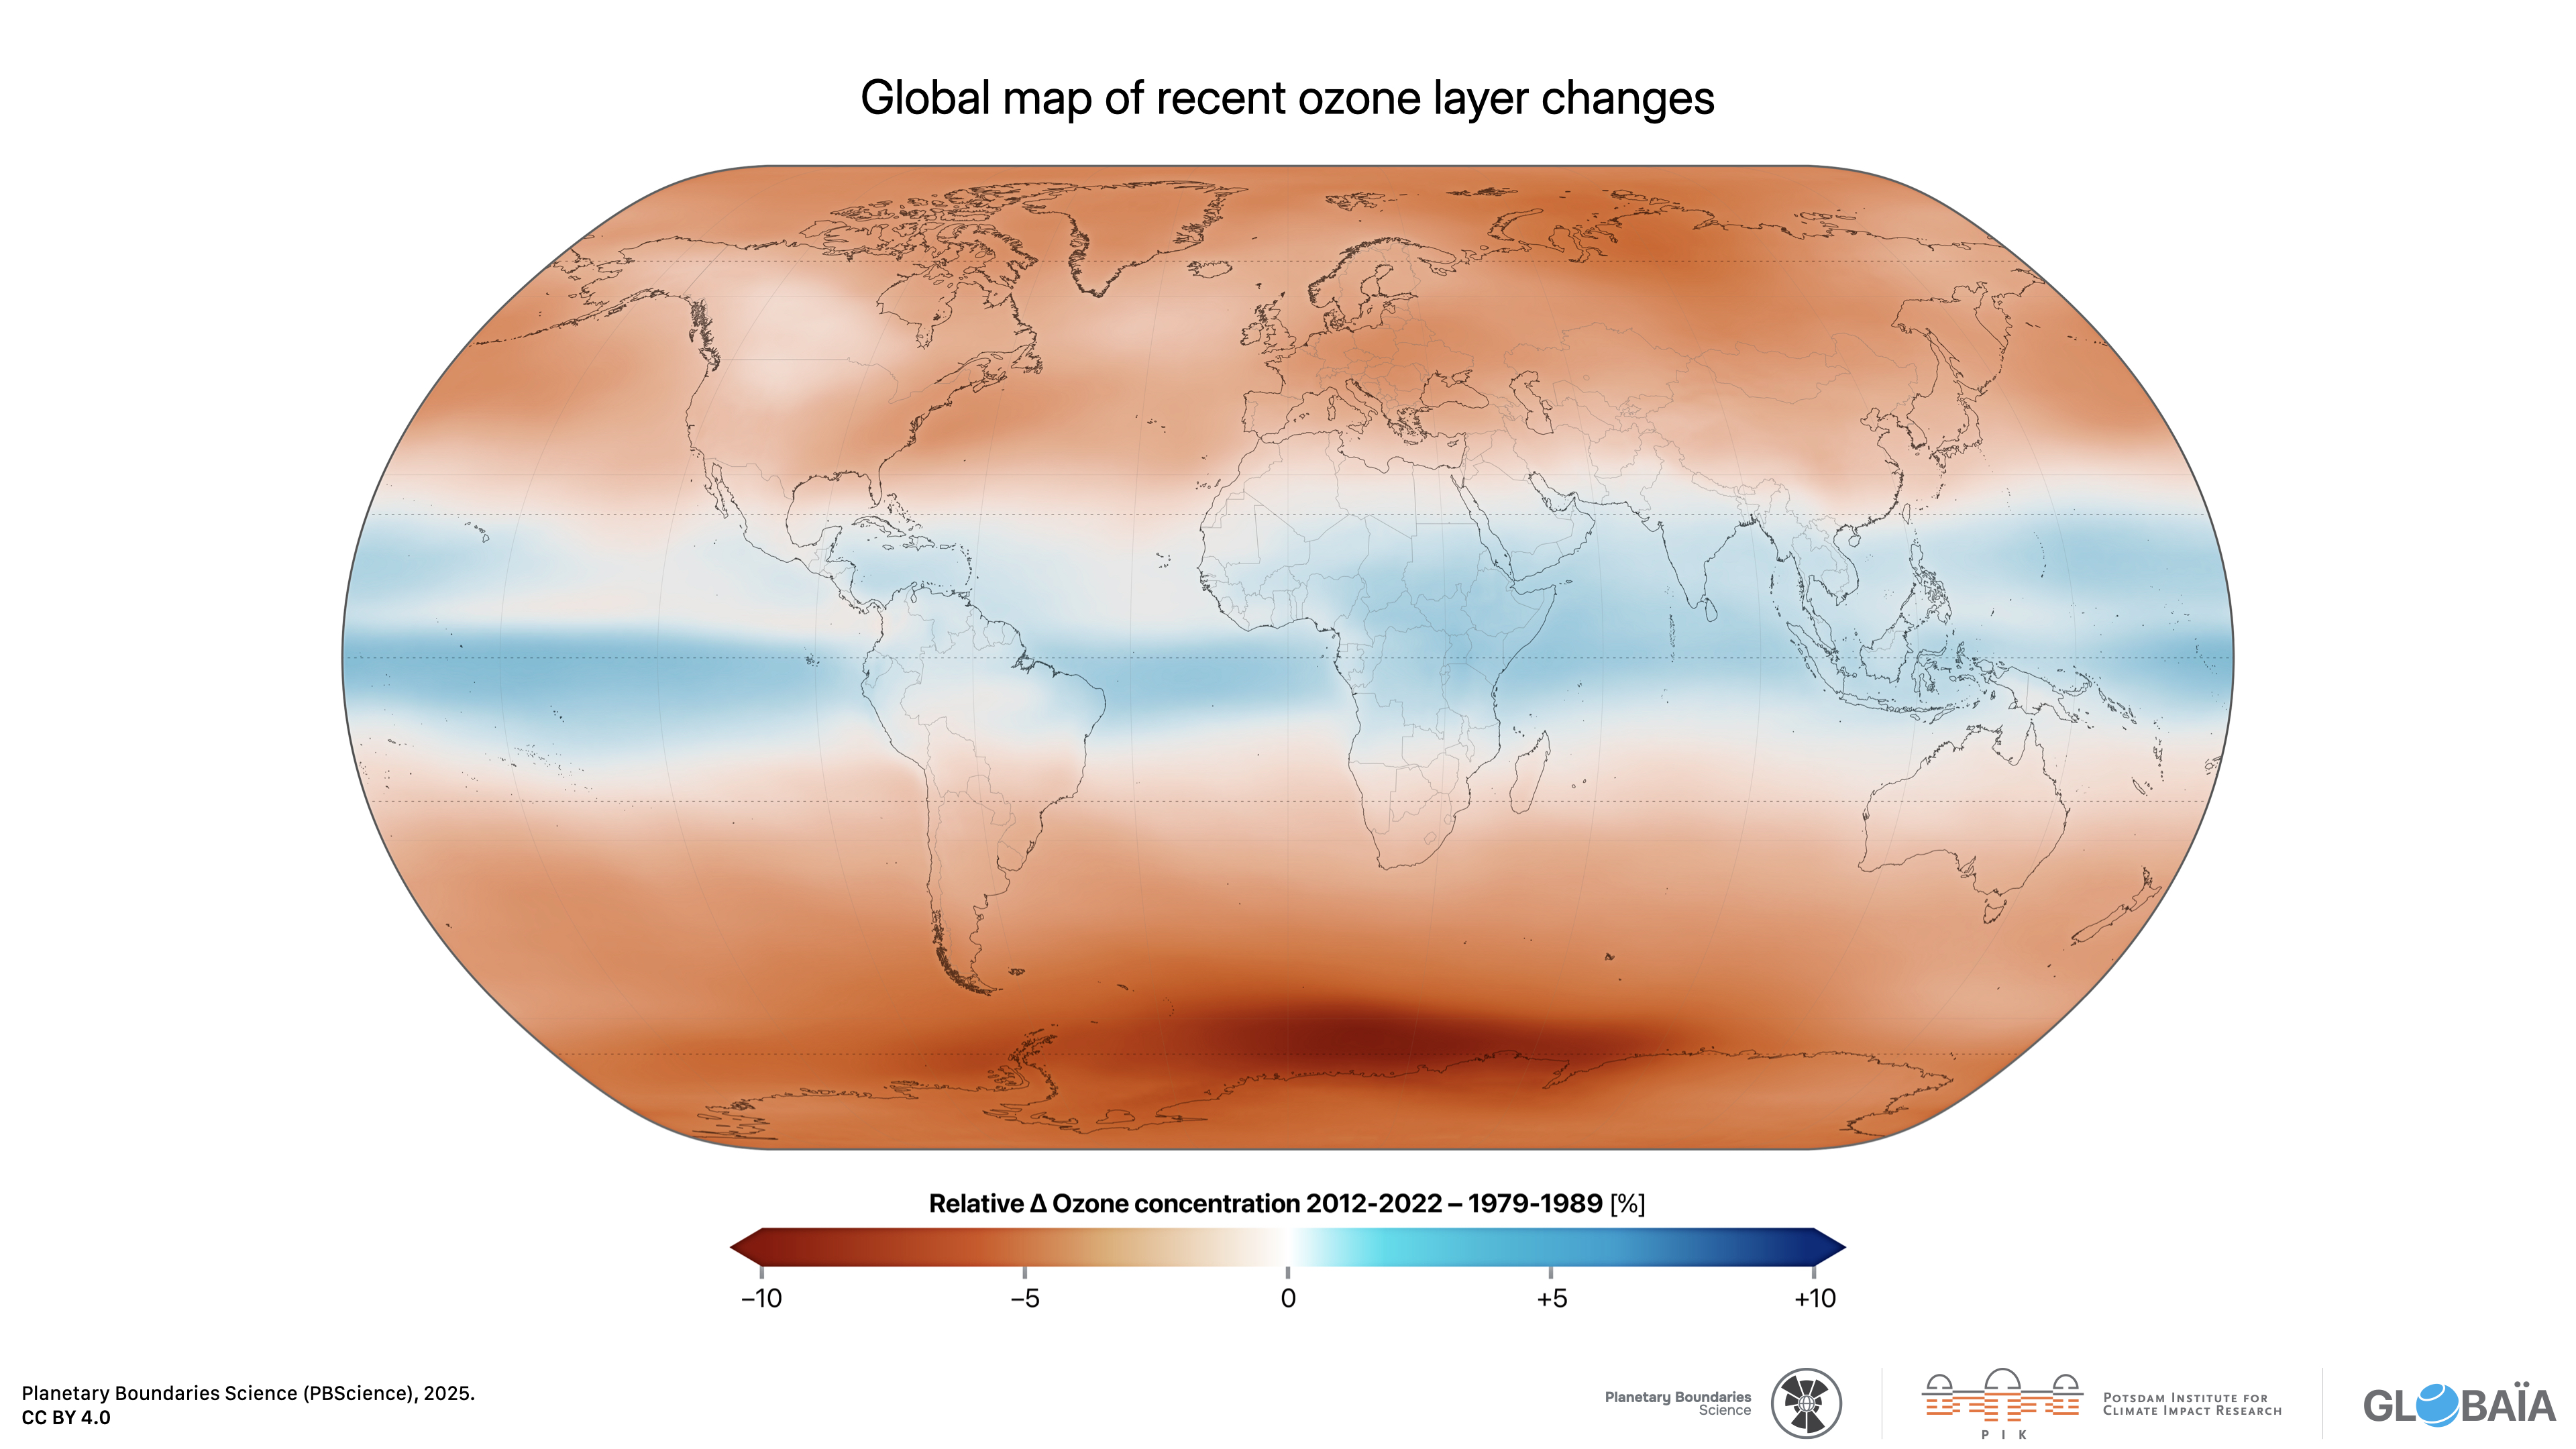
FIGURE 44 – Global map of recent ozone layer changes
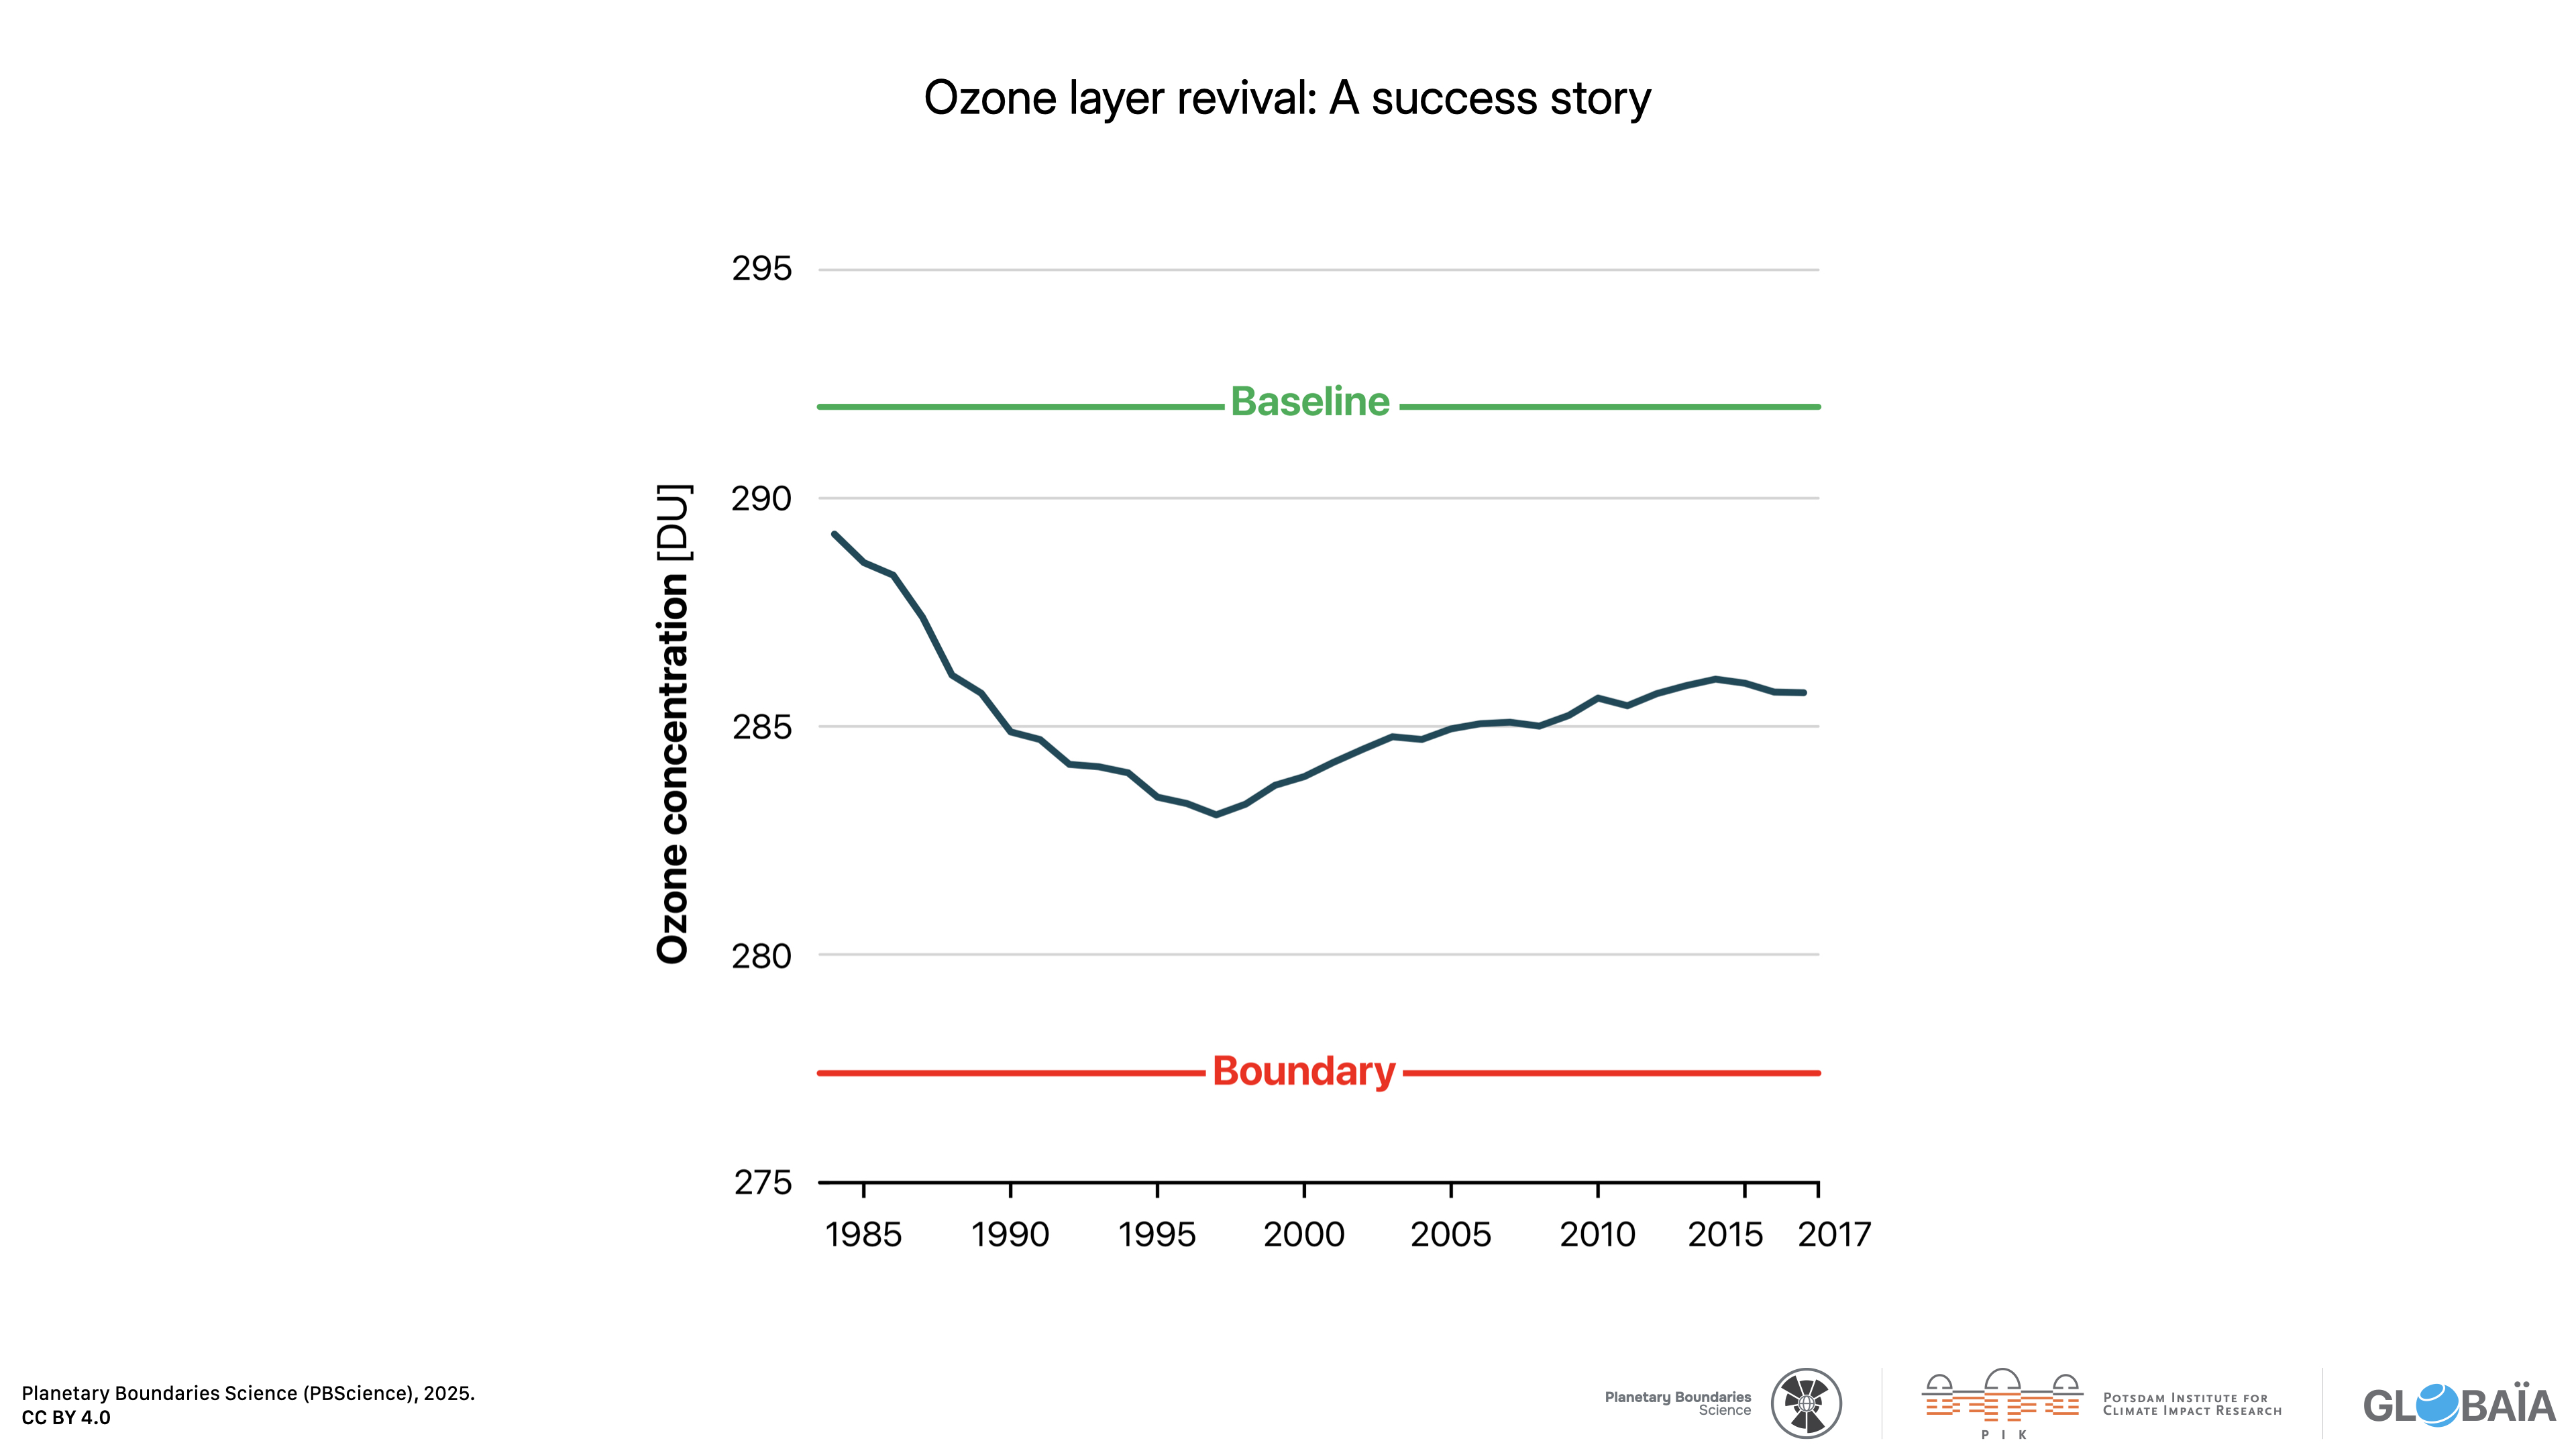
FIGURE 43 – Ozone layer revival: A success story
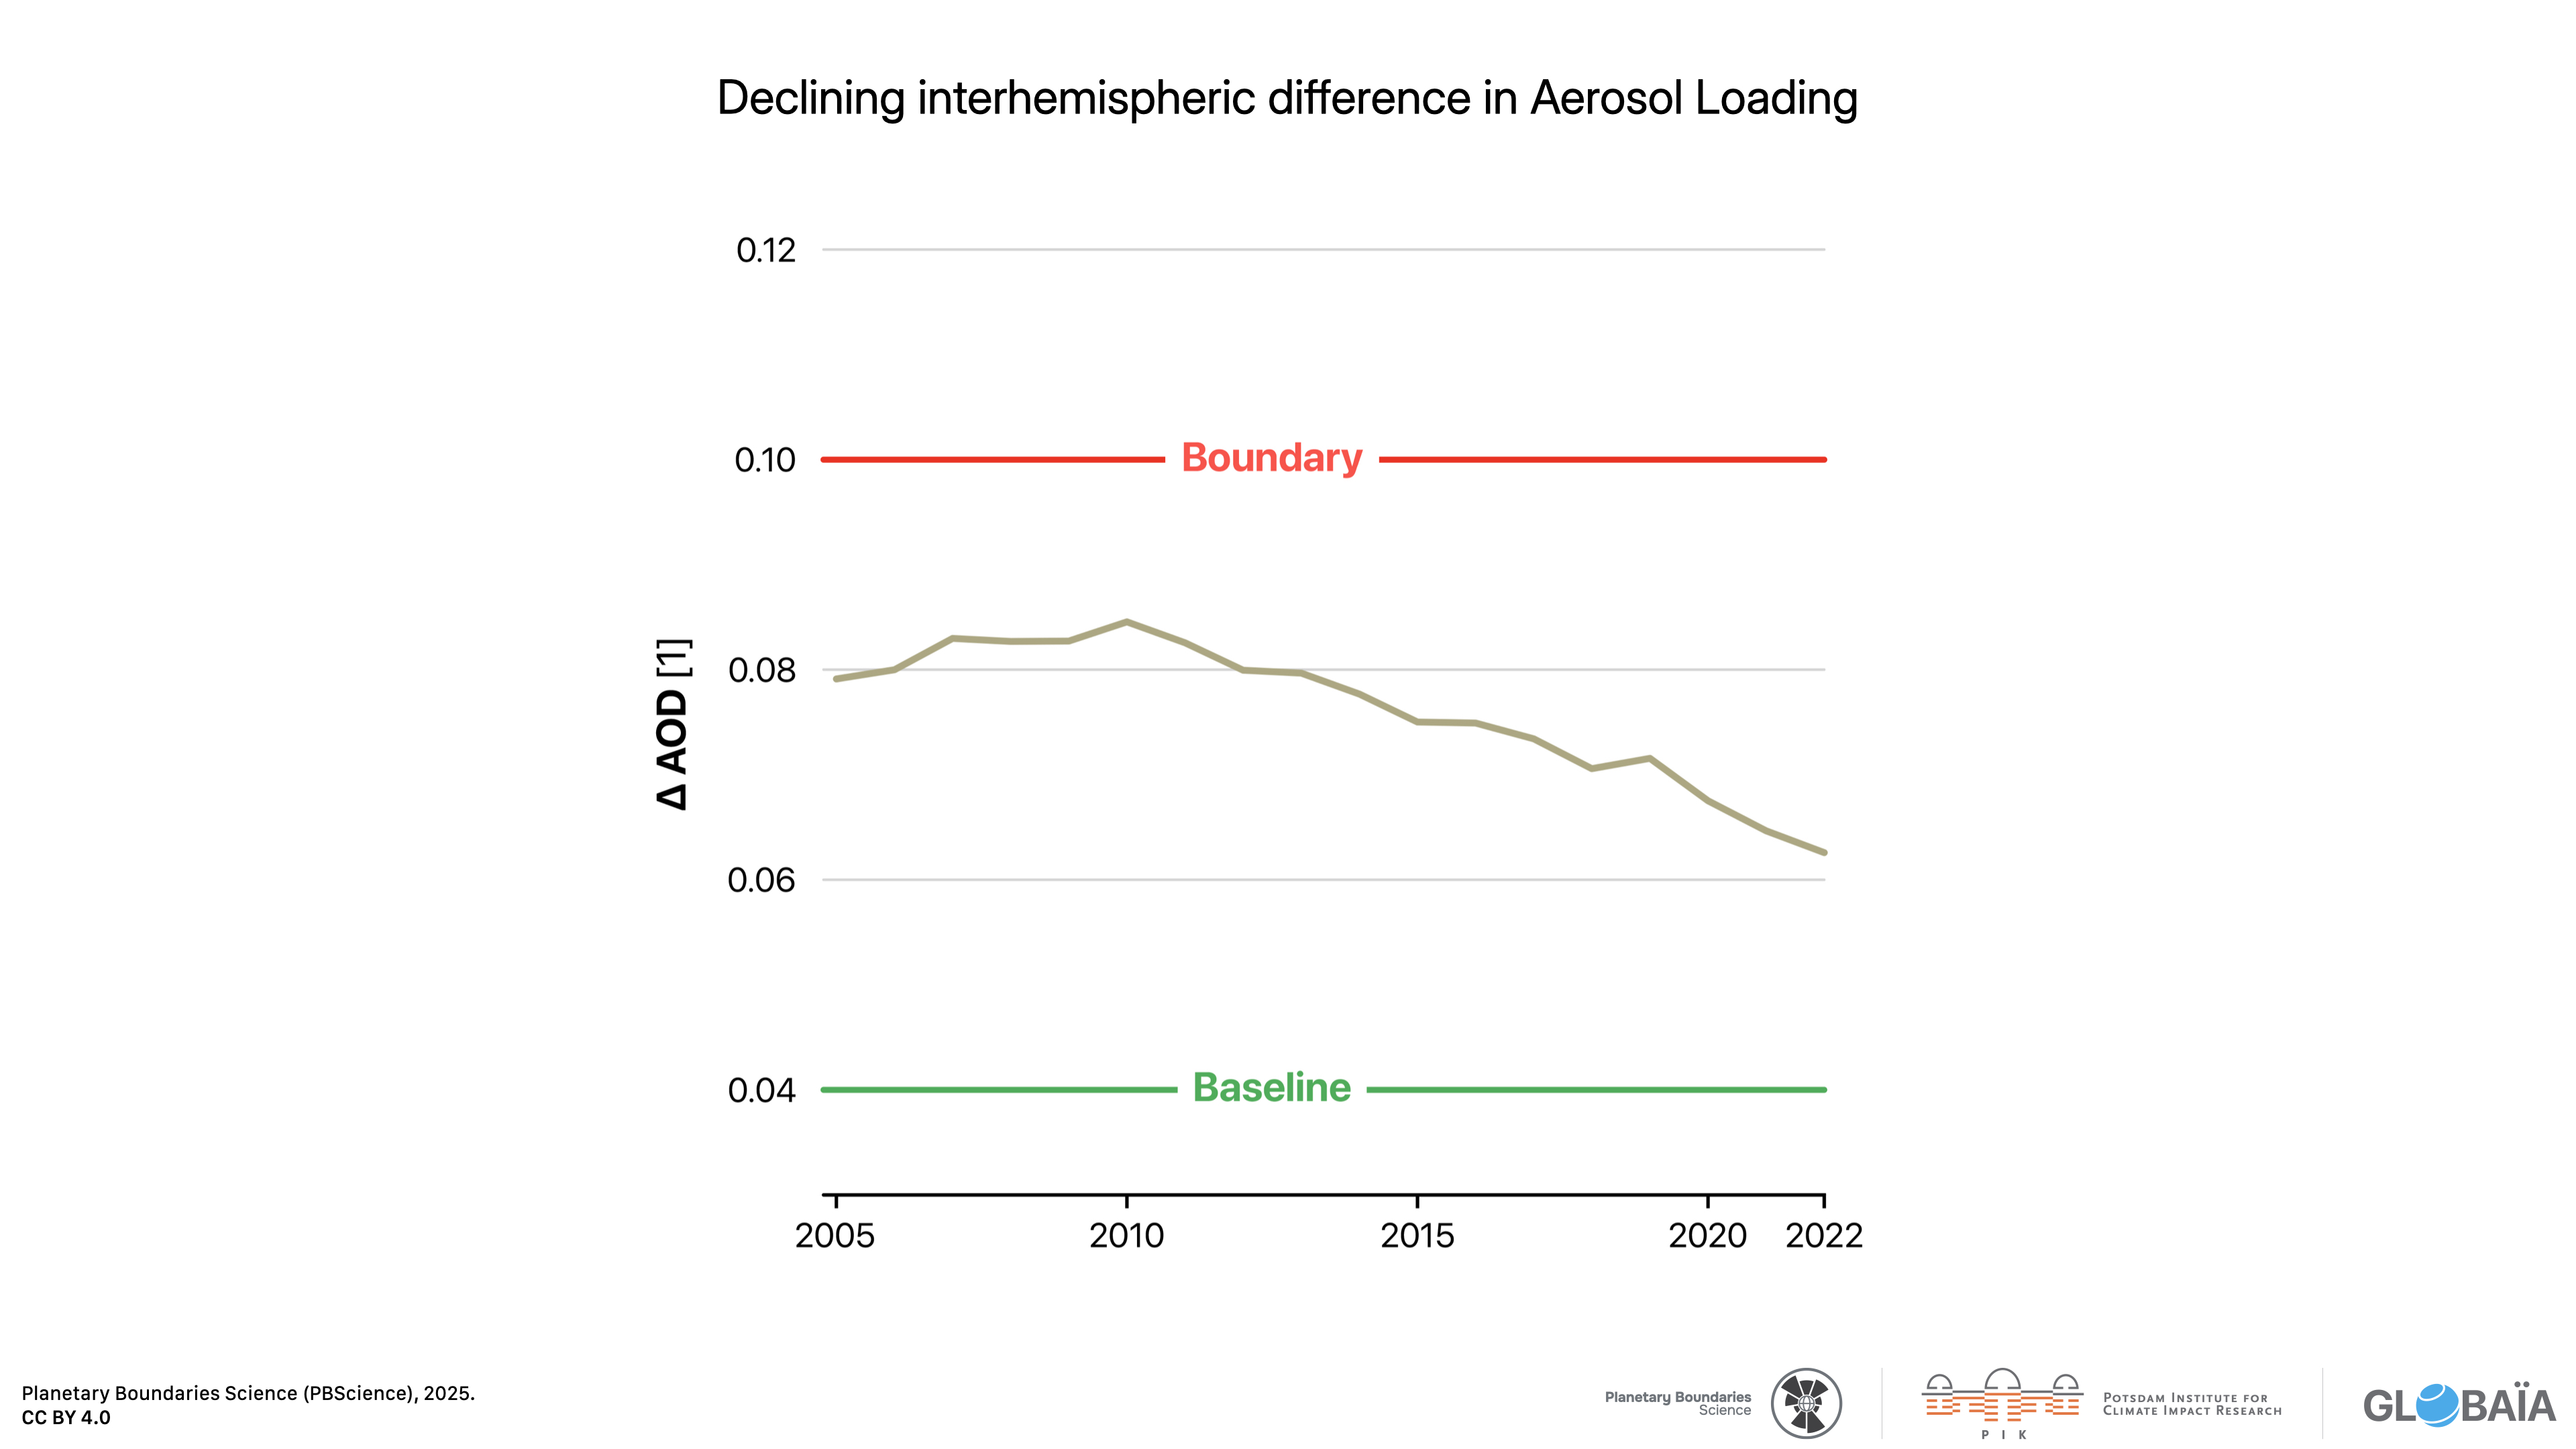
FIGURE 42 – Bridging the divide: Declining interhemispheric difference in Aerosol Loading
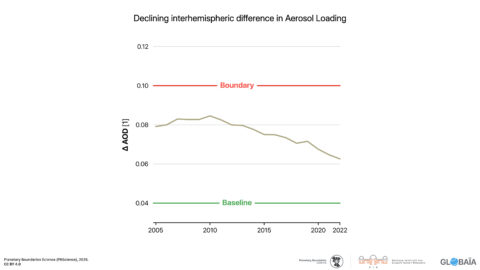
FIGURE 41 – Effective radiative forcing (W m⁻²) of sulfur dioxide and black carbon, averaged annually over 2010–2020
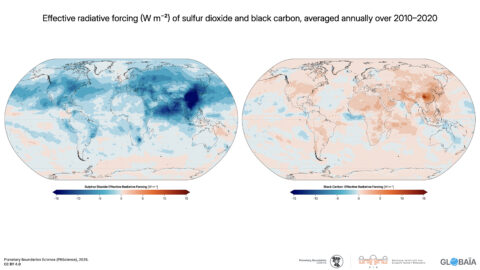
FIGURE 40 – Global aerosol emissions, averaged annually over 2010–2020
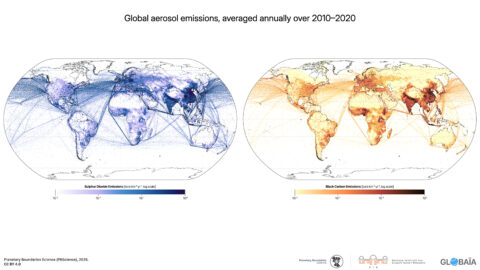
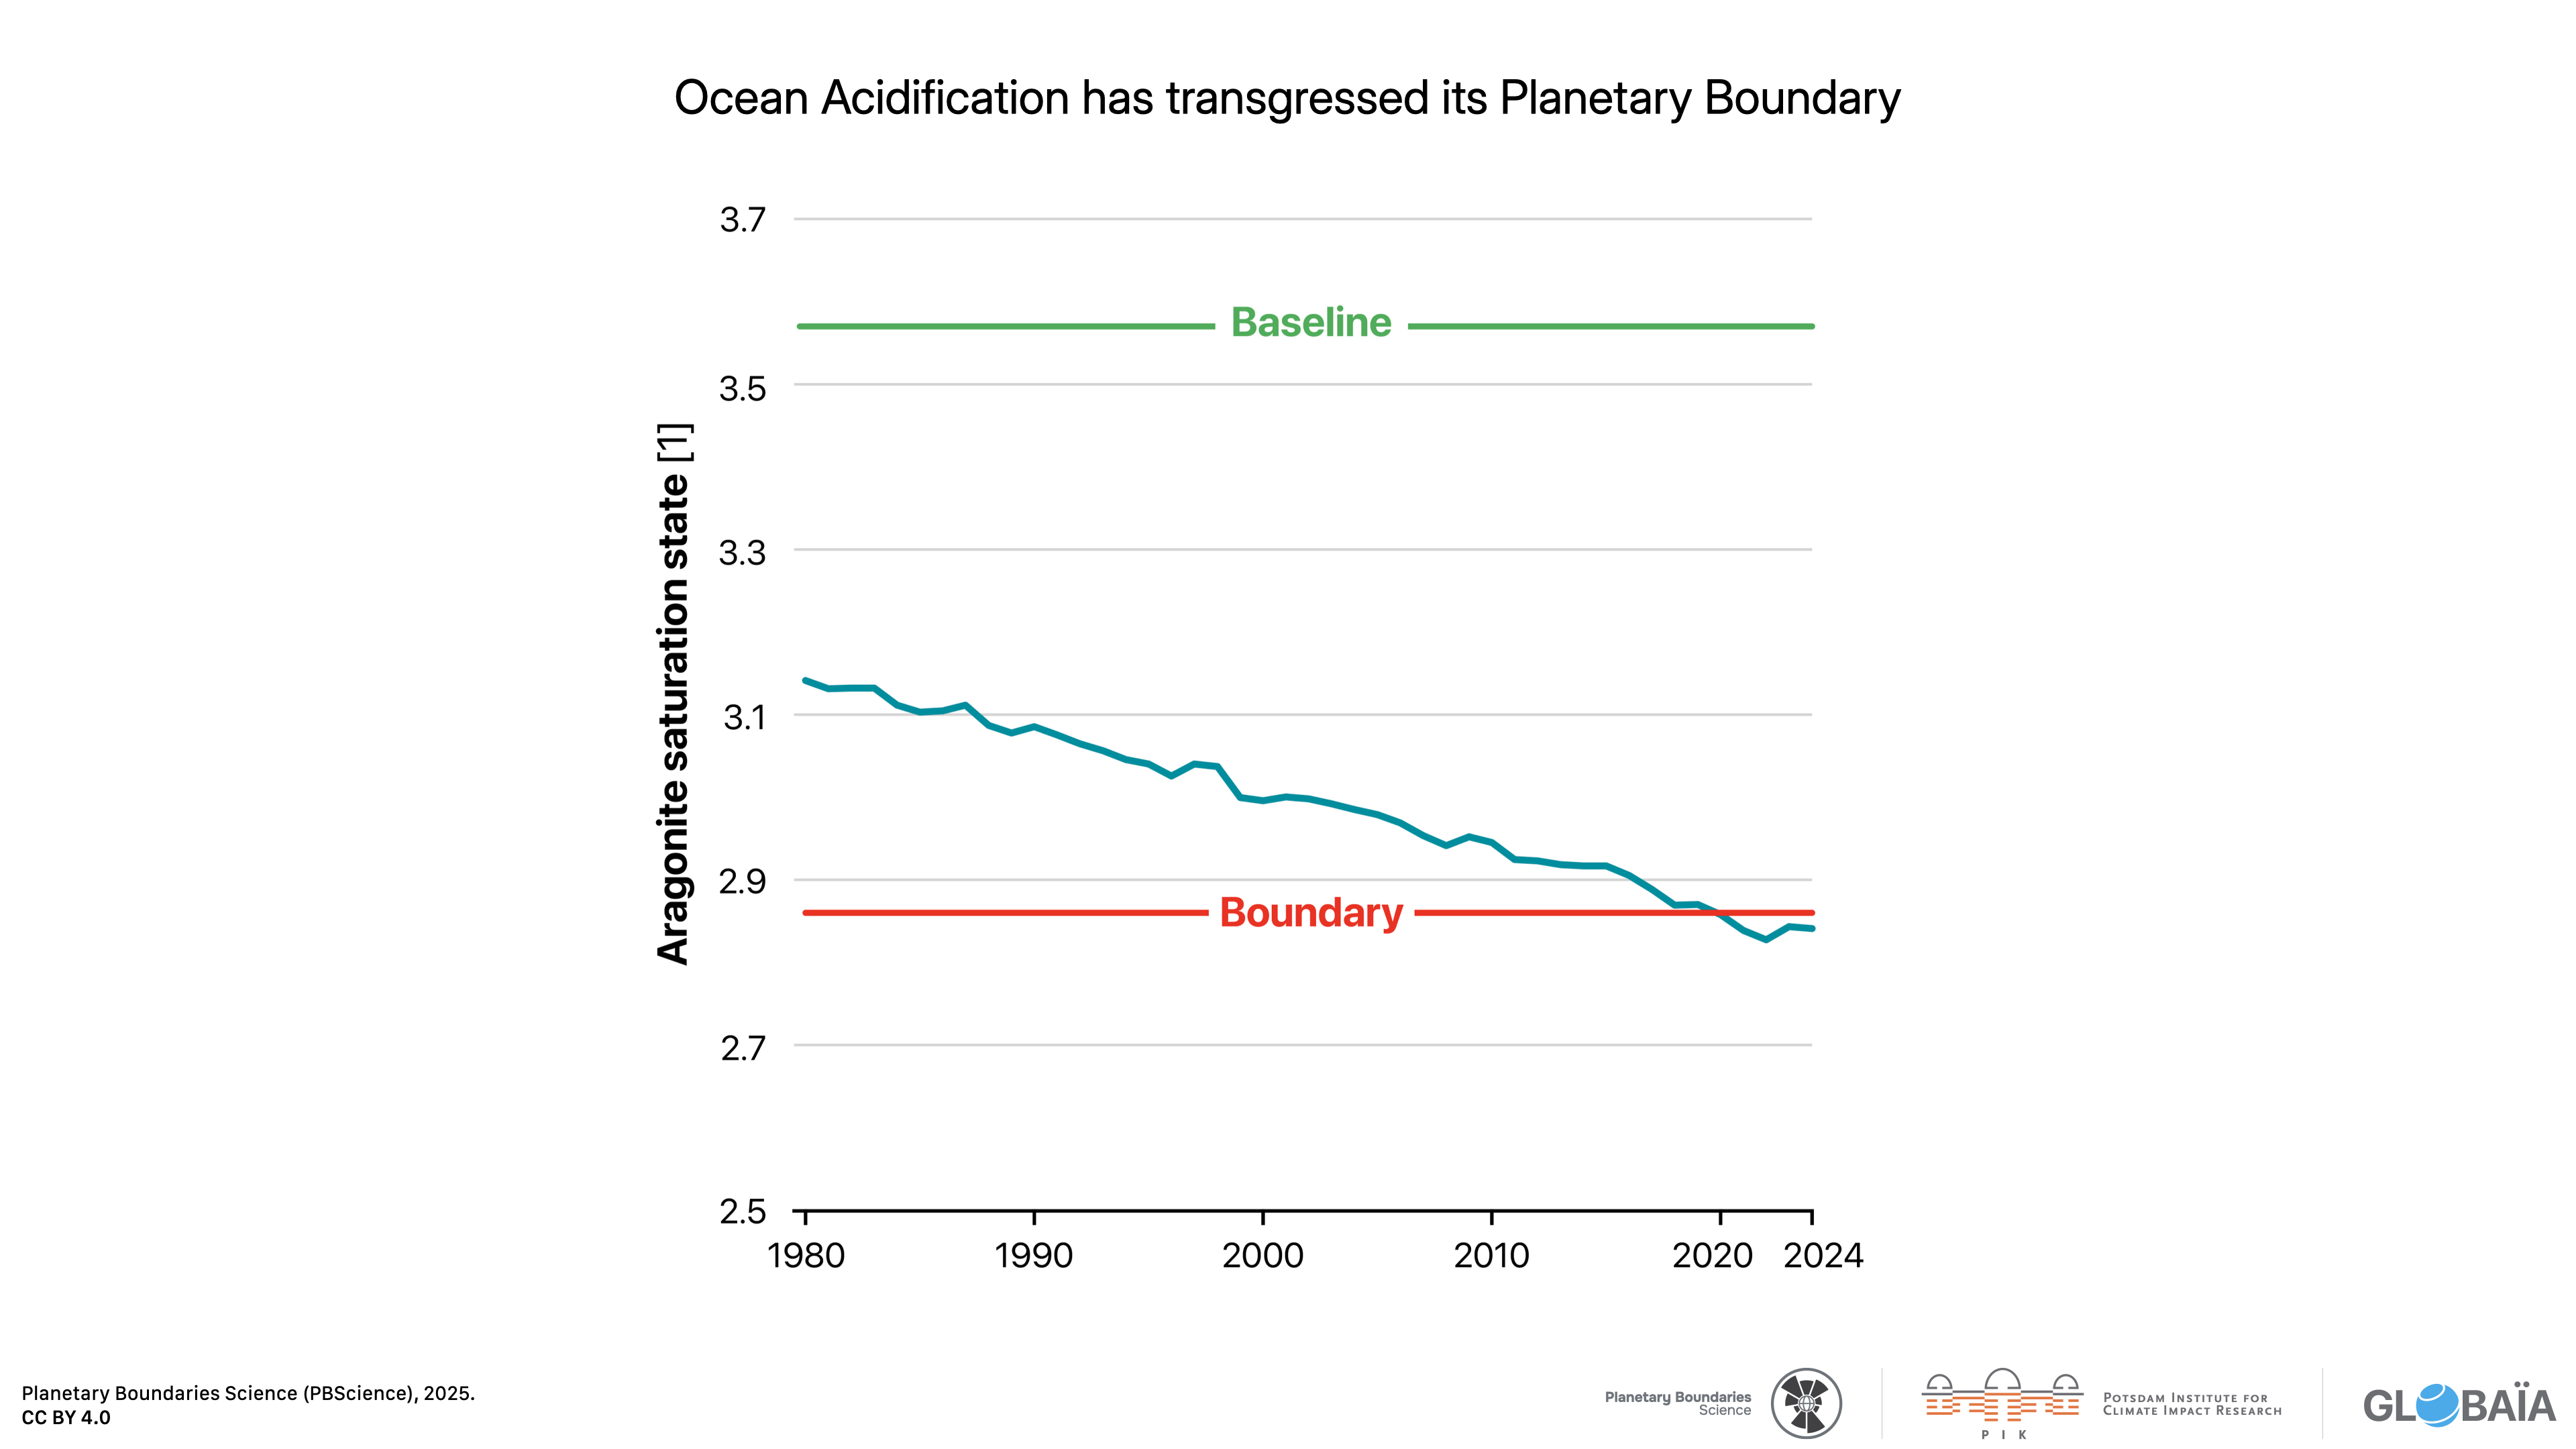
FIGURE 39 – Ocean Acidification has transgressed its Planetary Boundary
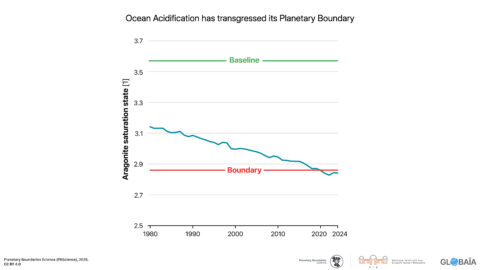
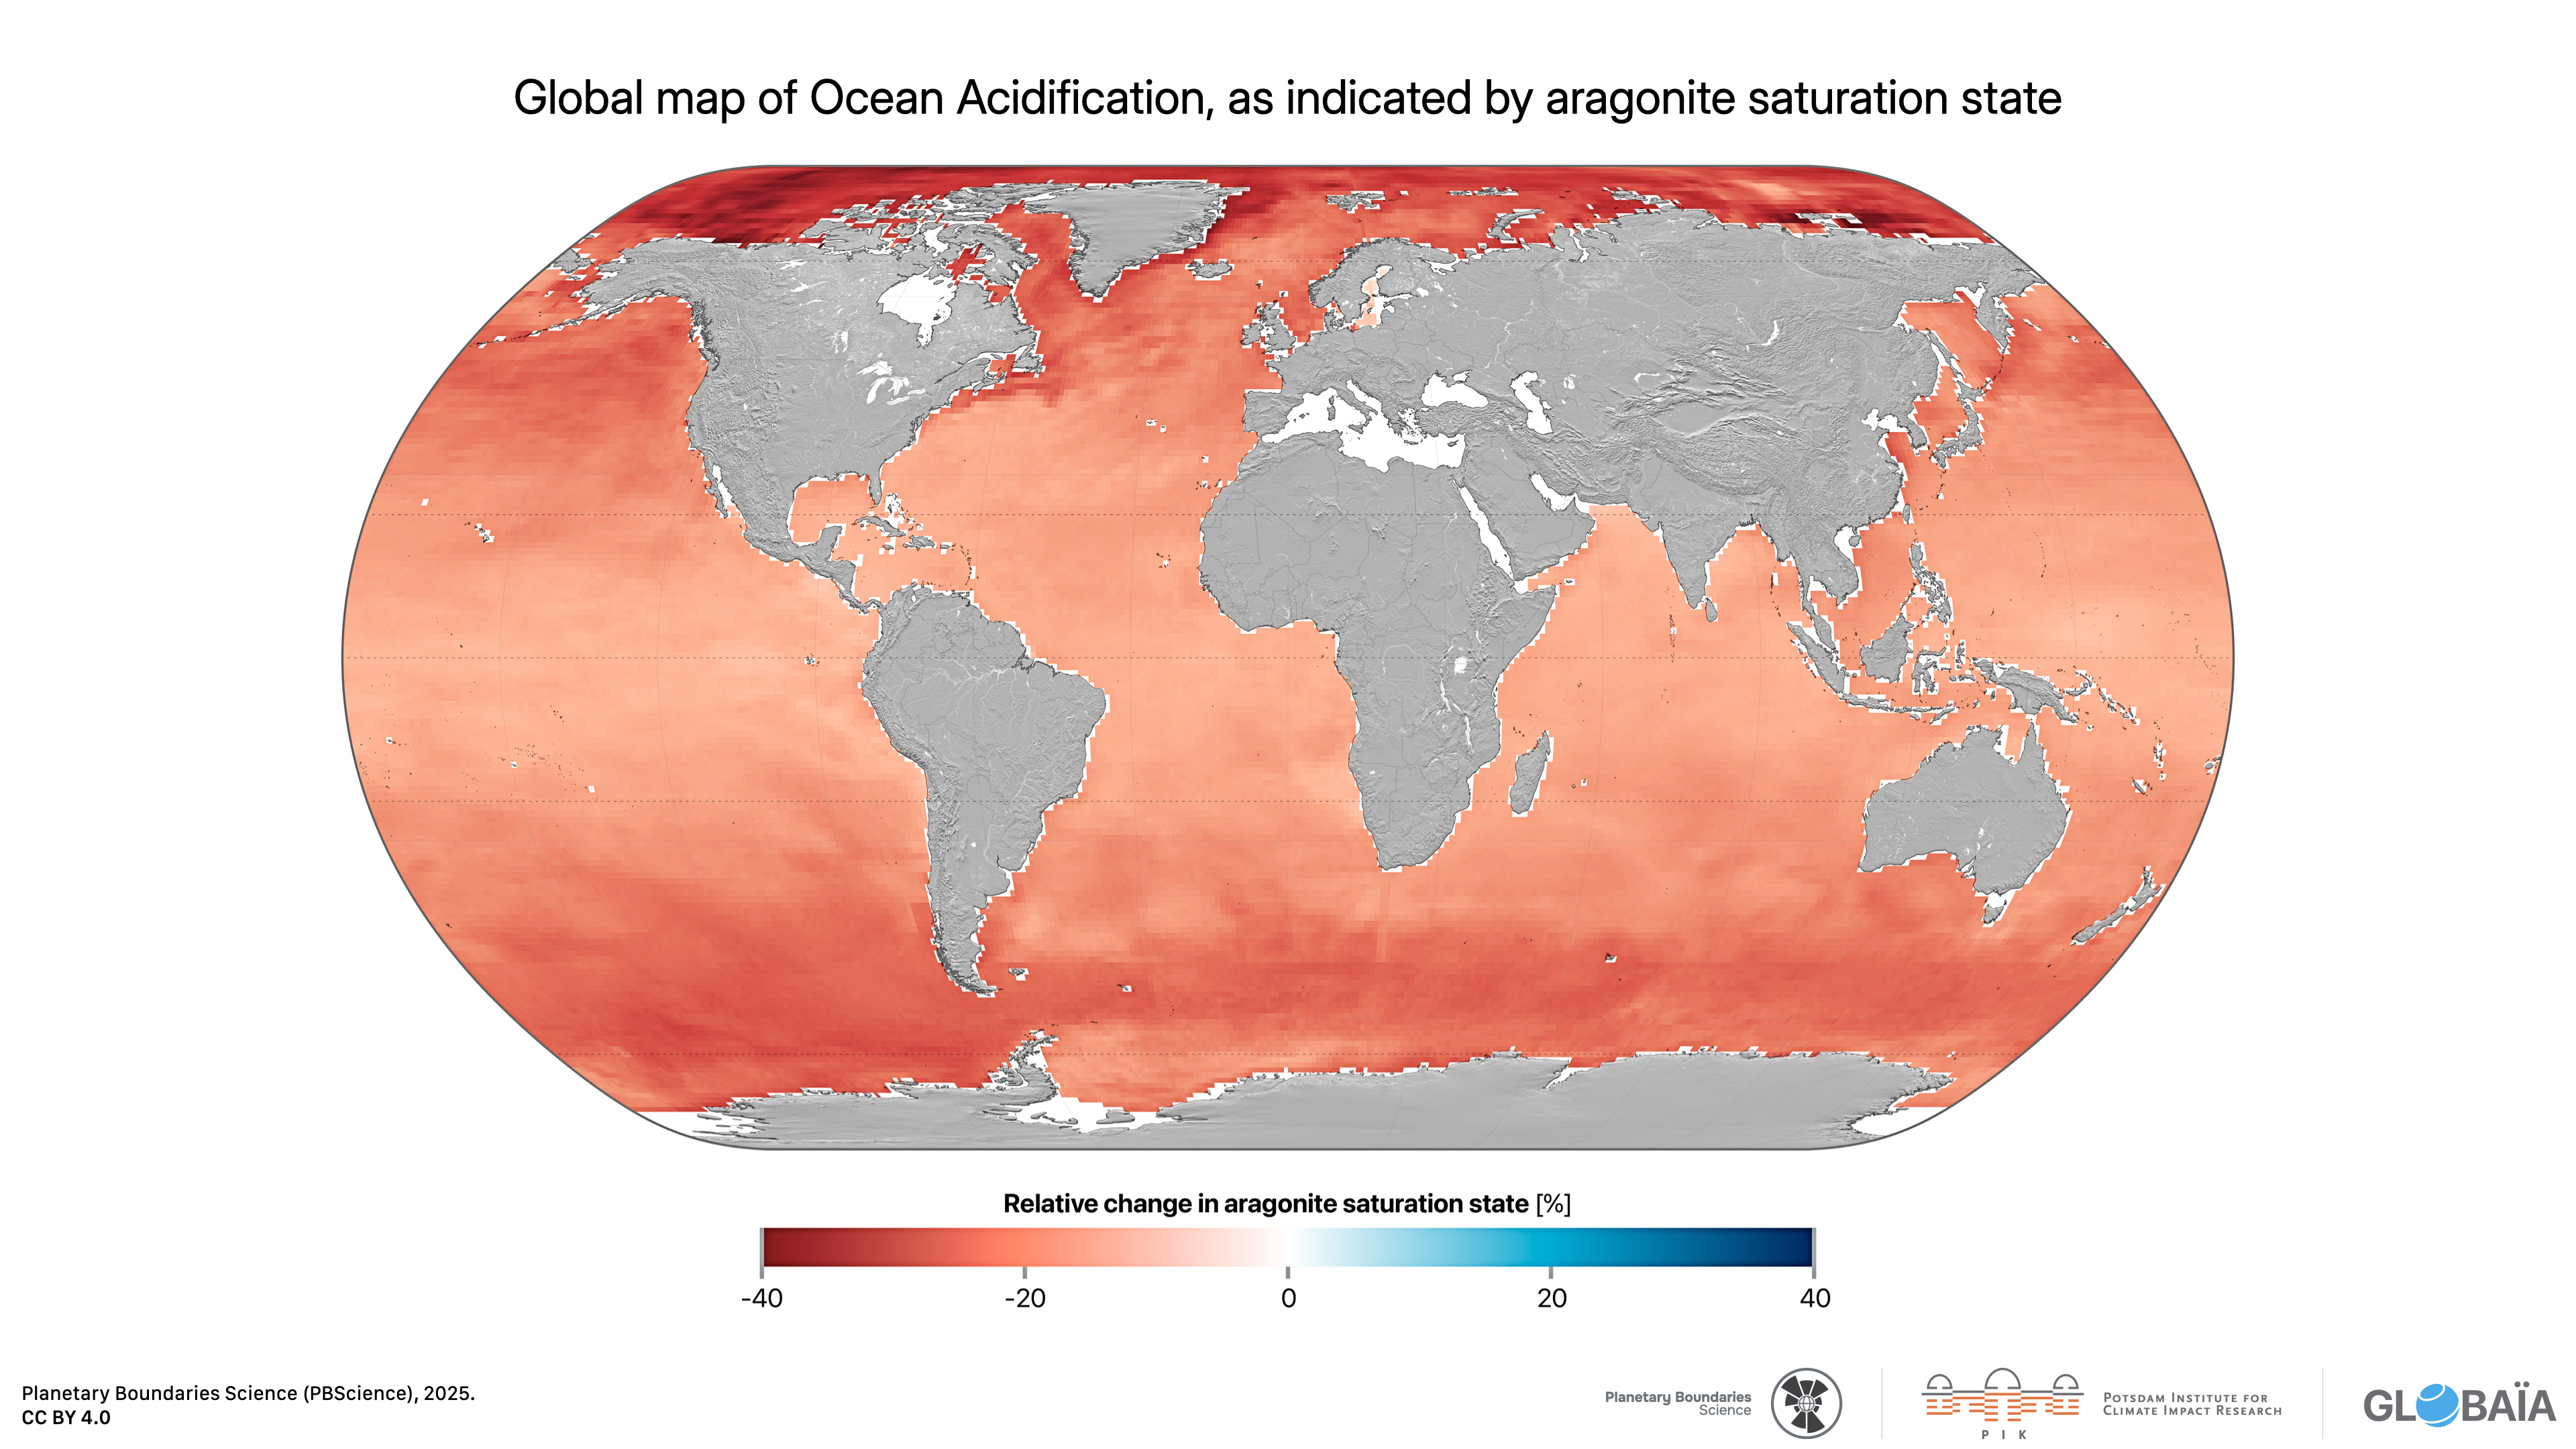
FIGURE 38 – Global map of Ocean Acidification, as indicated by aragonite saturation state
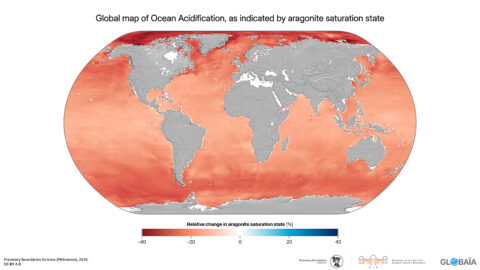
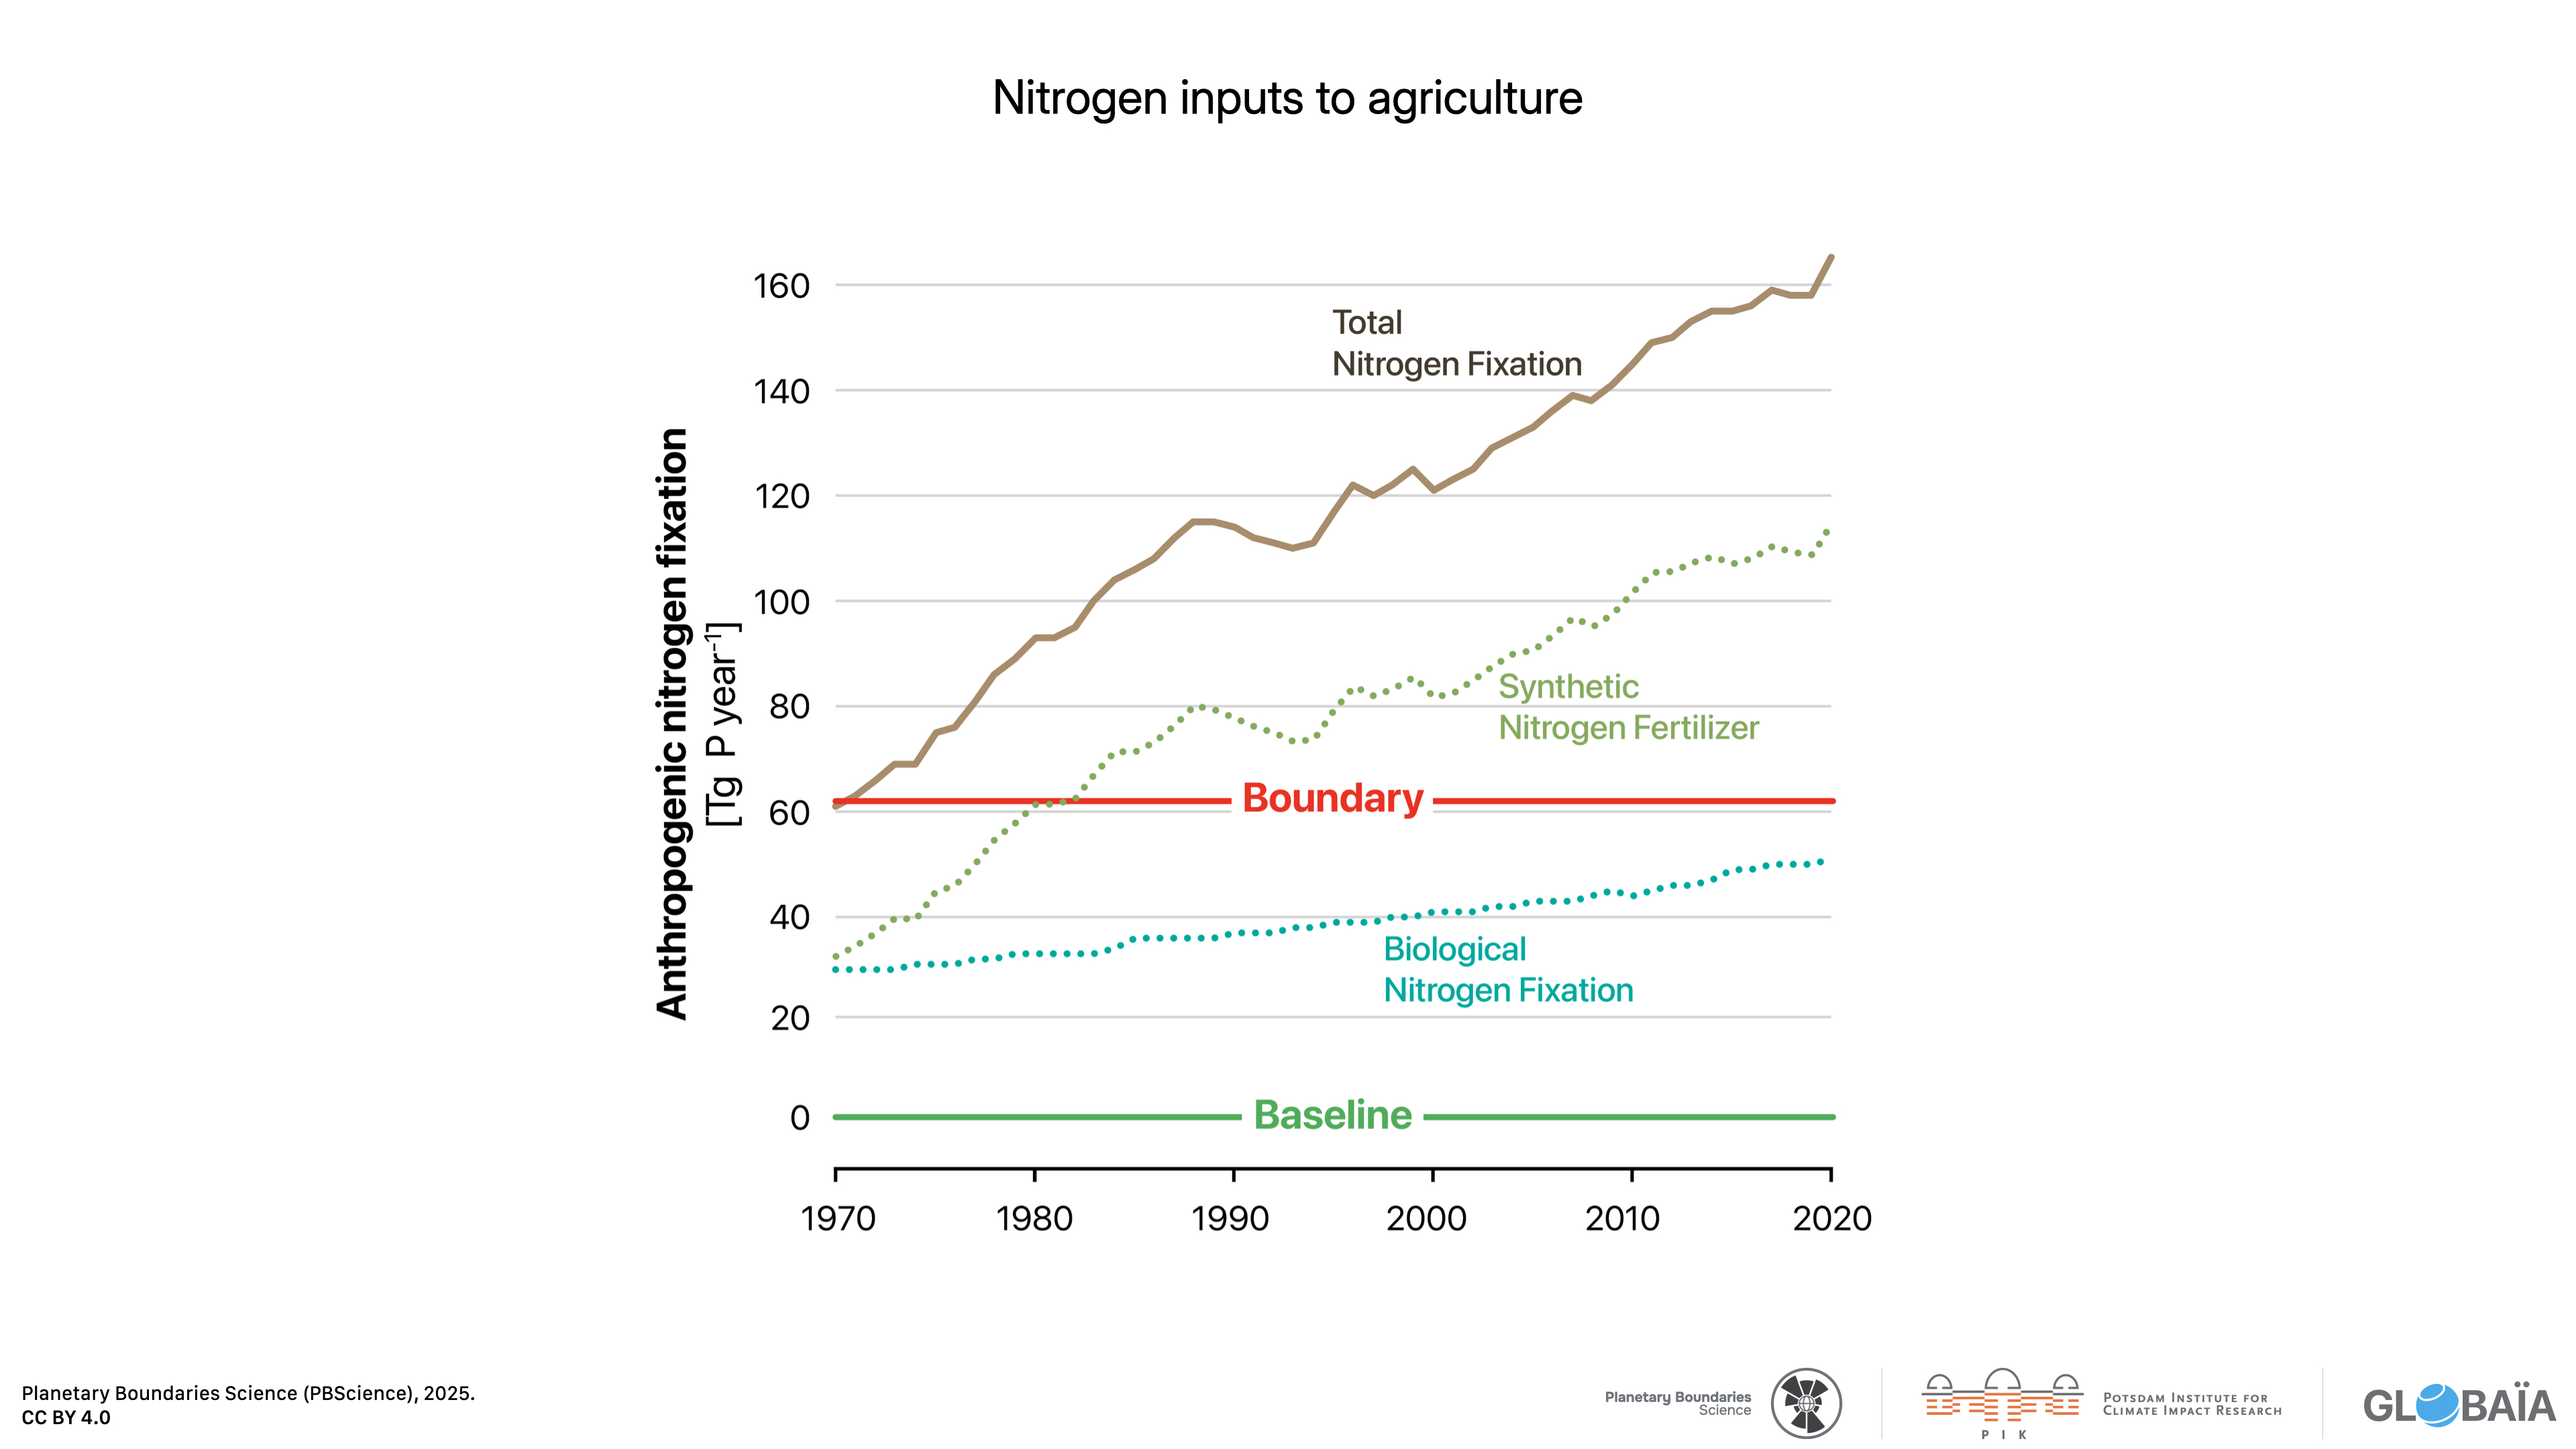
FIGURE 37 – Nitrogen inputs to agriculture
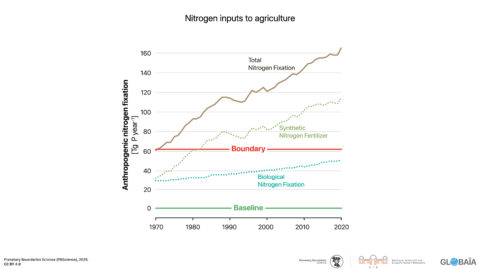
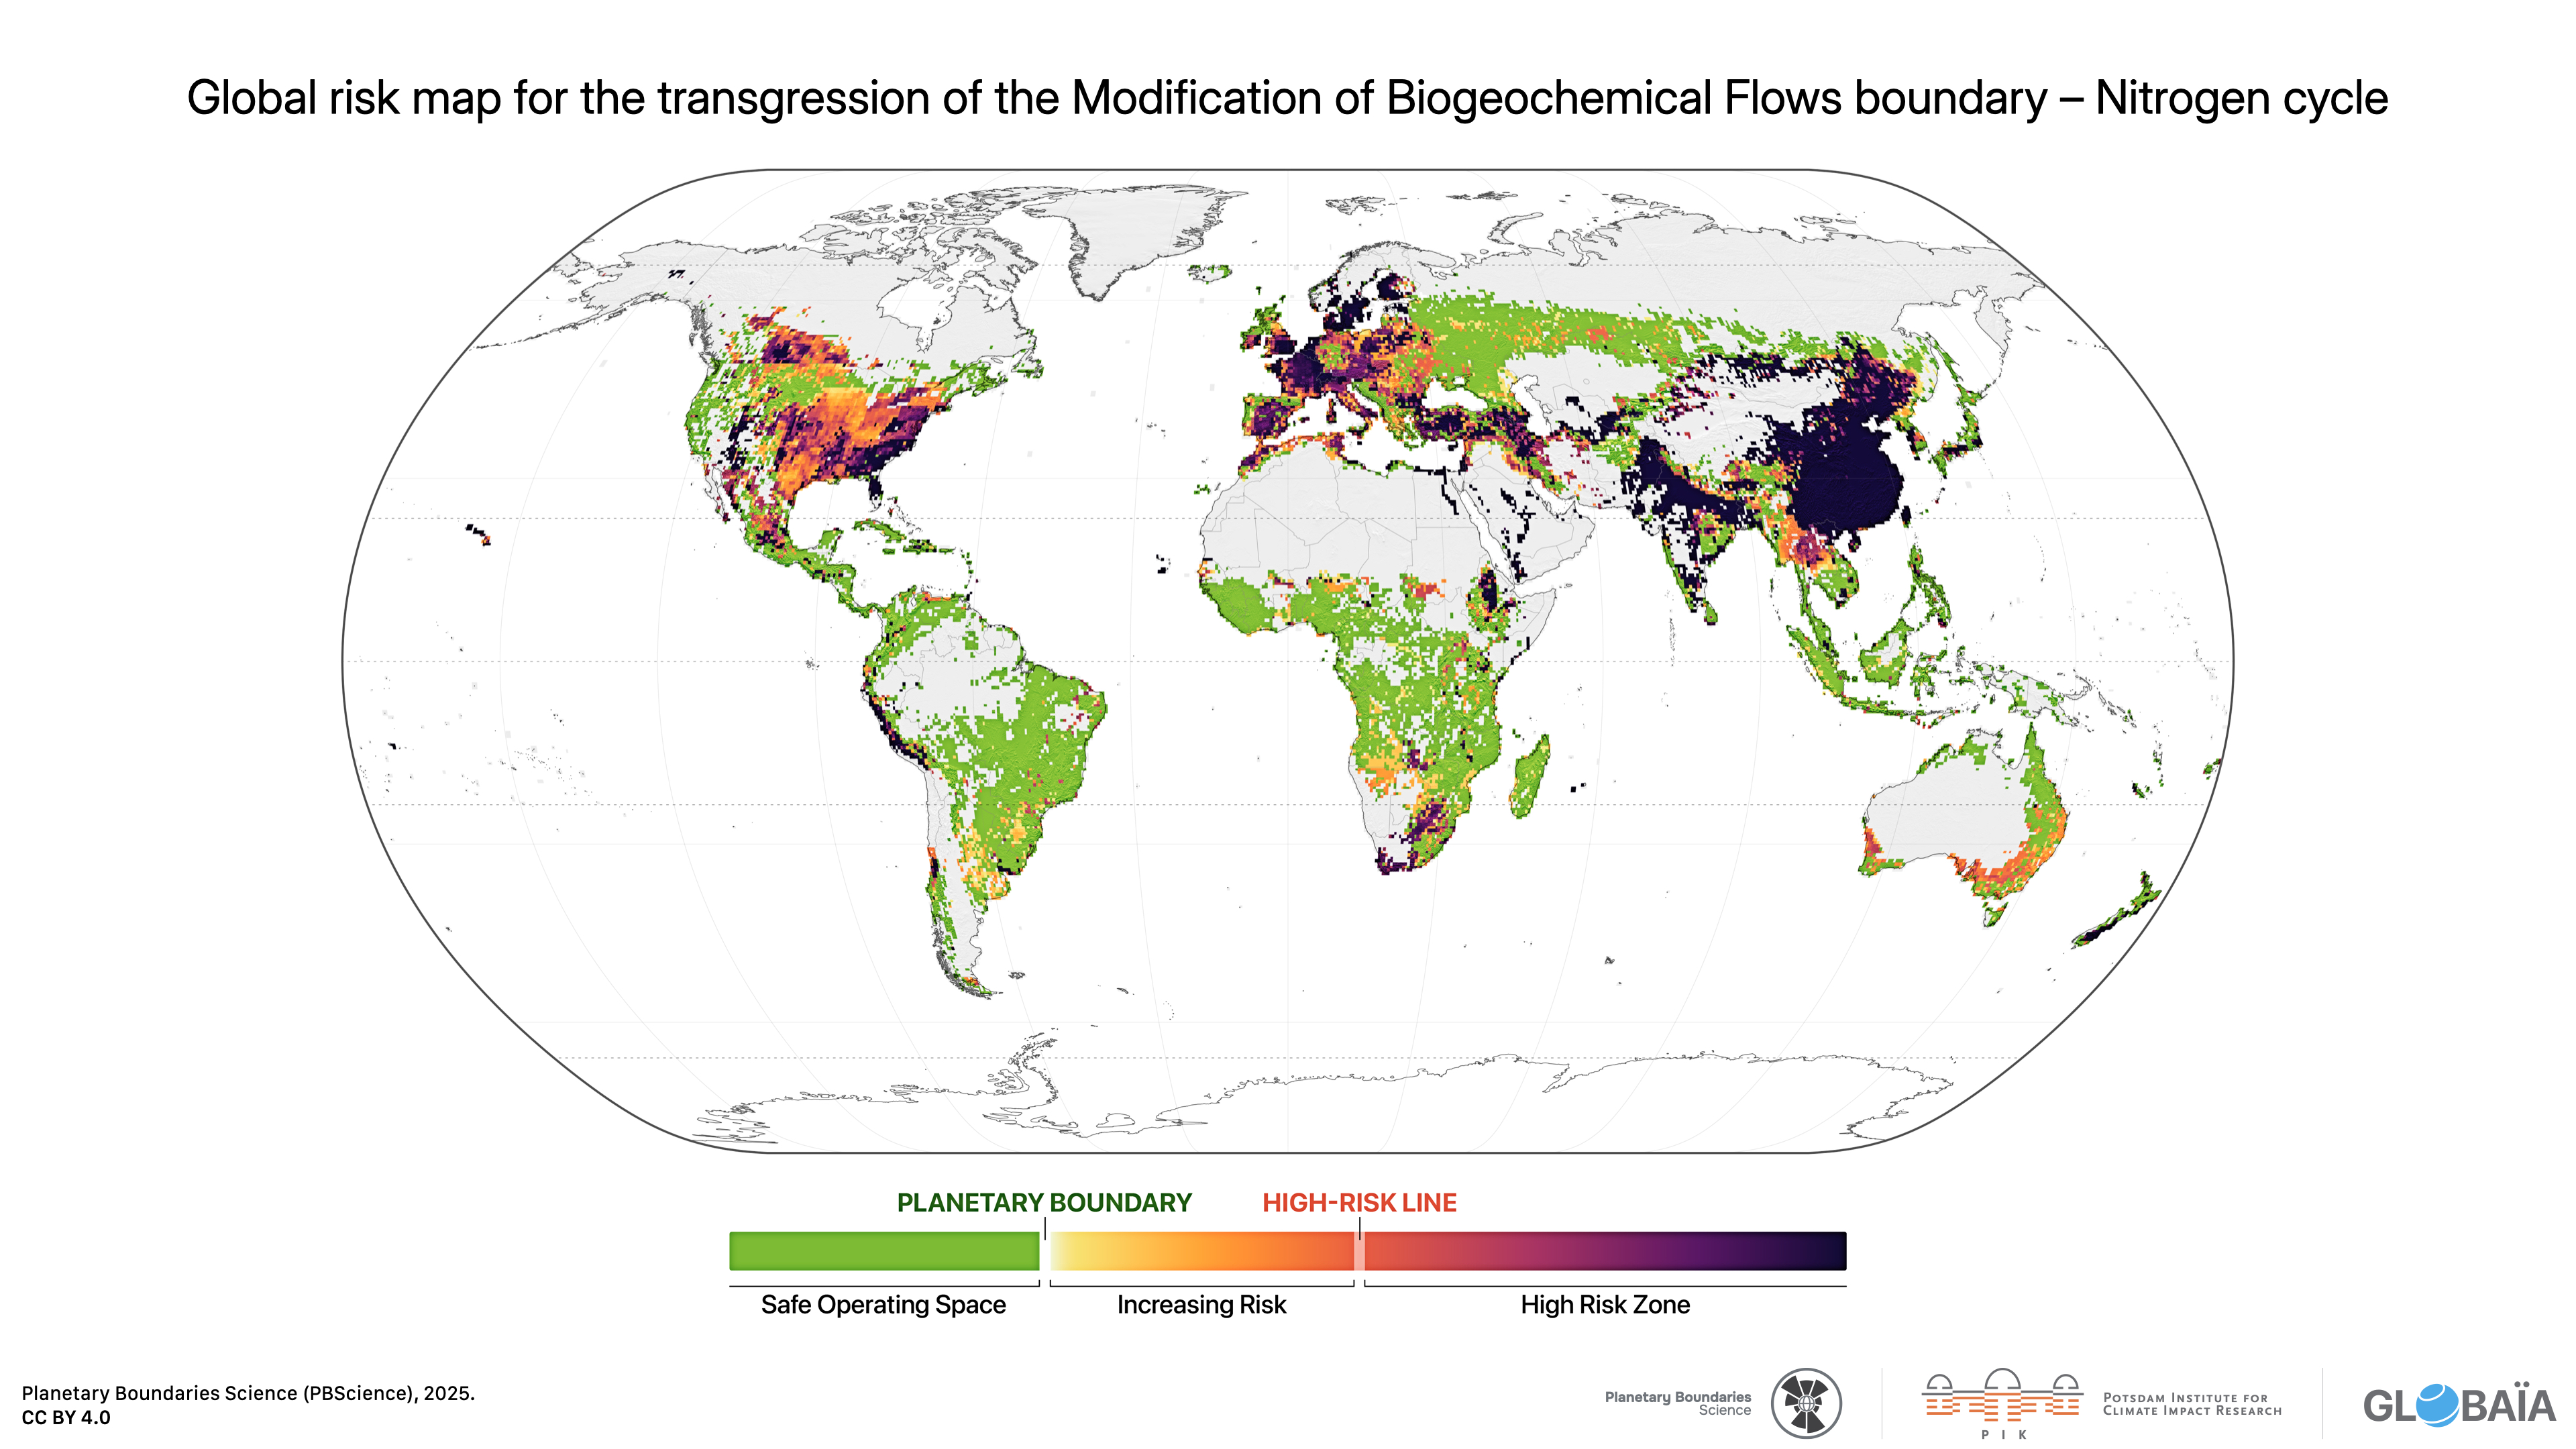
FIGURE 36 – Global risk map for the transgression of the Modification of Biogeochemical Flows boundary – Nitrogen cycle

FIGURE 35 – Phosphorus inputs to global cropland
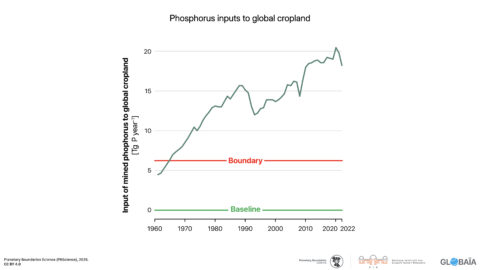
FIGURE 34 – Global risk map for the transgression of the Modification of Biogeochemical Flows boundary – Phosphorus cycle
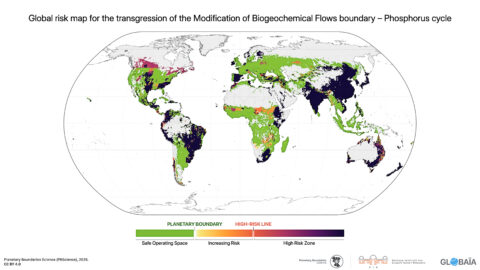
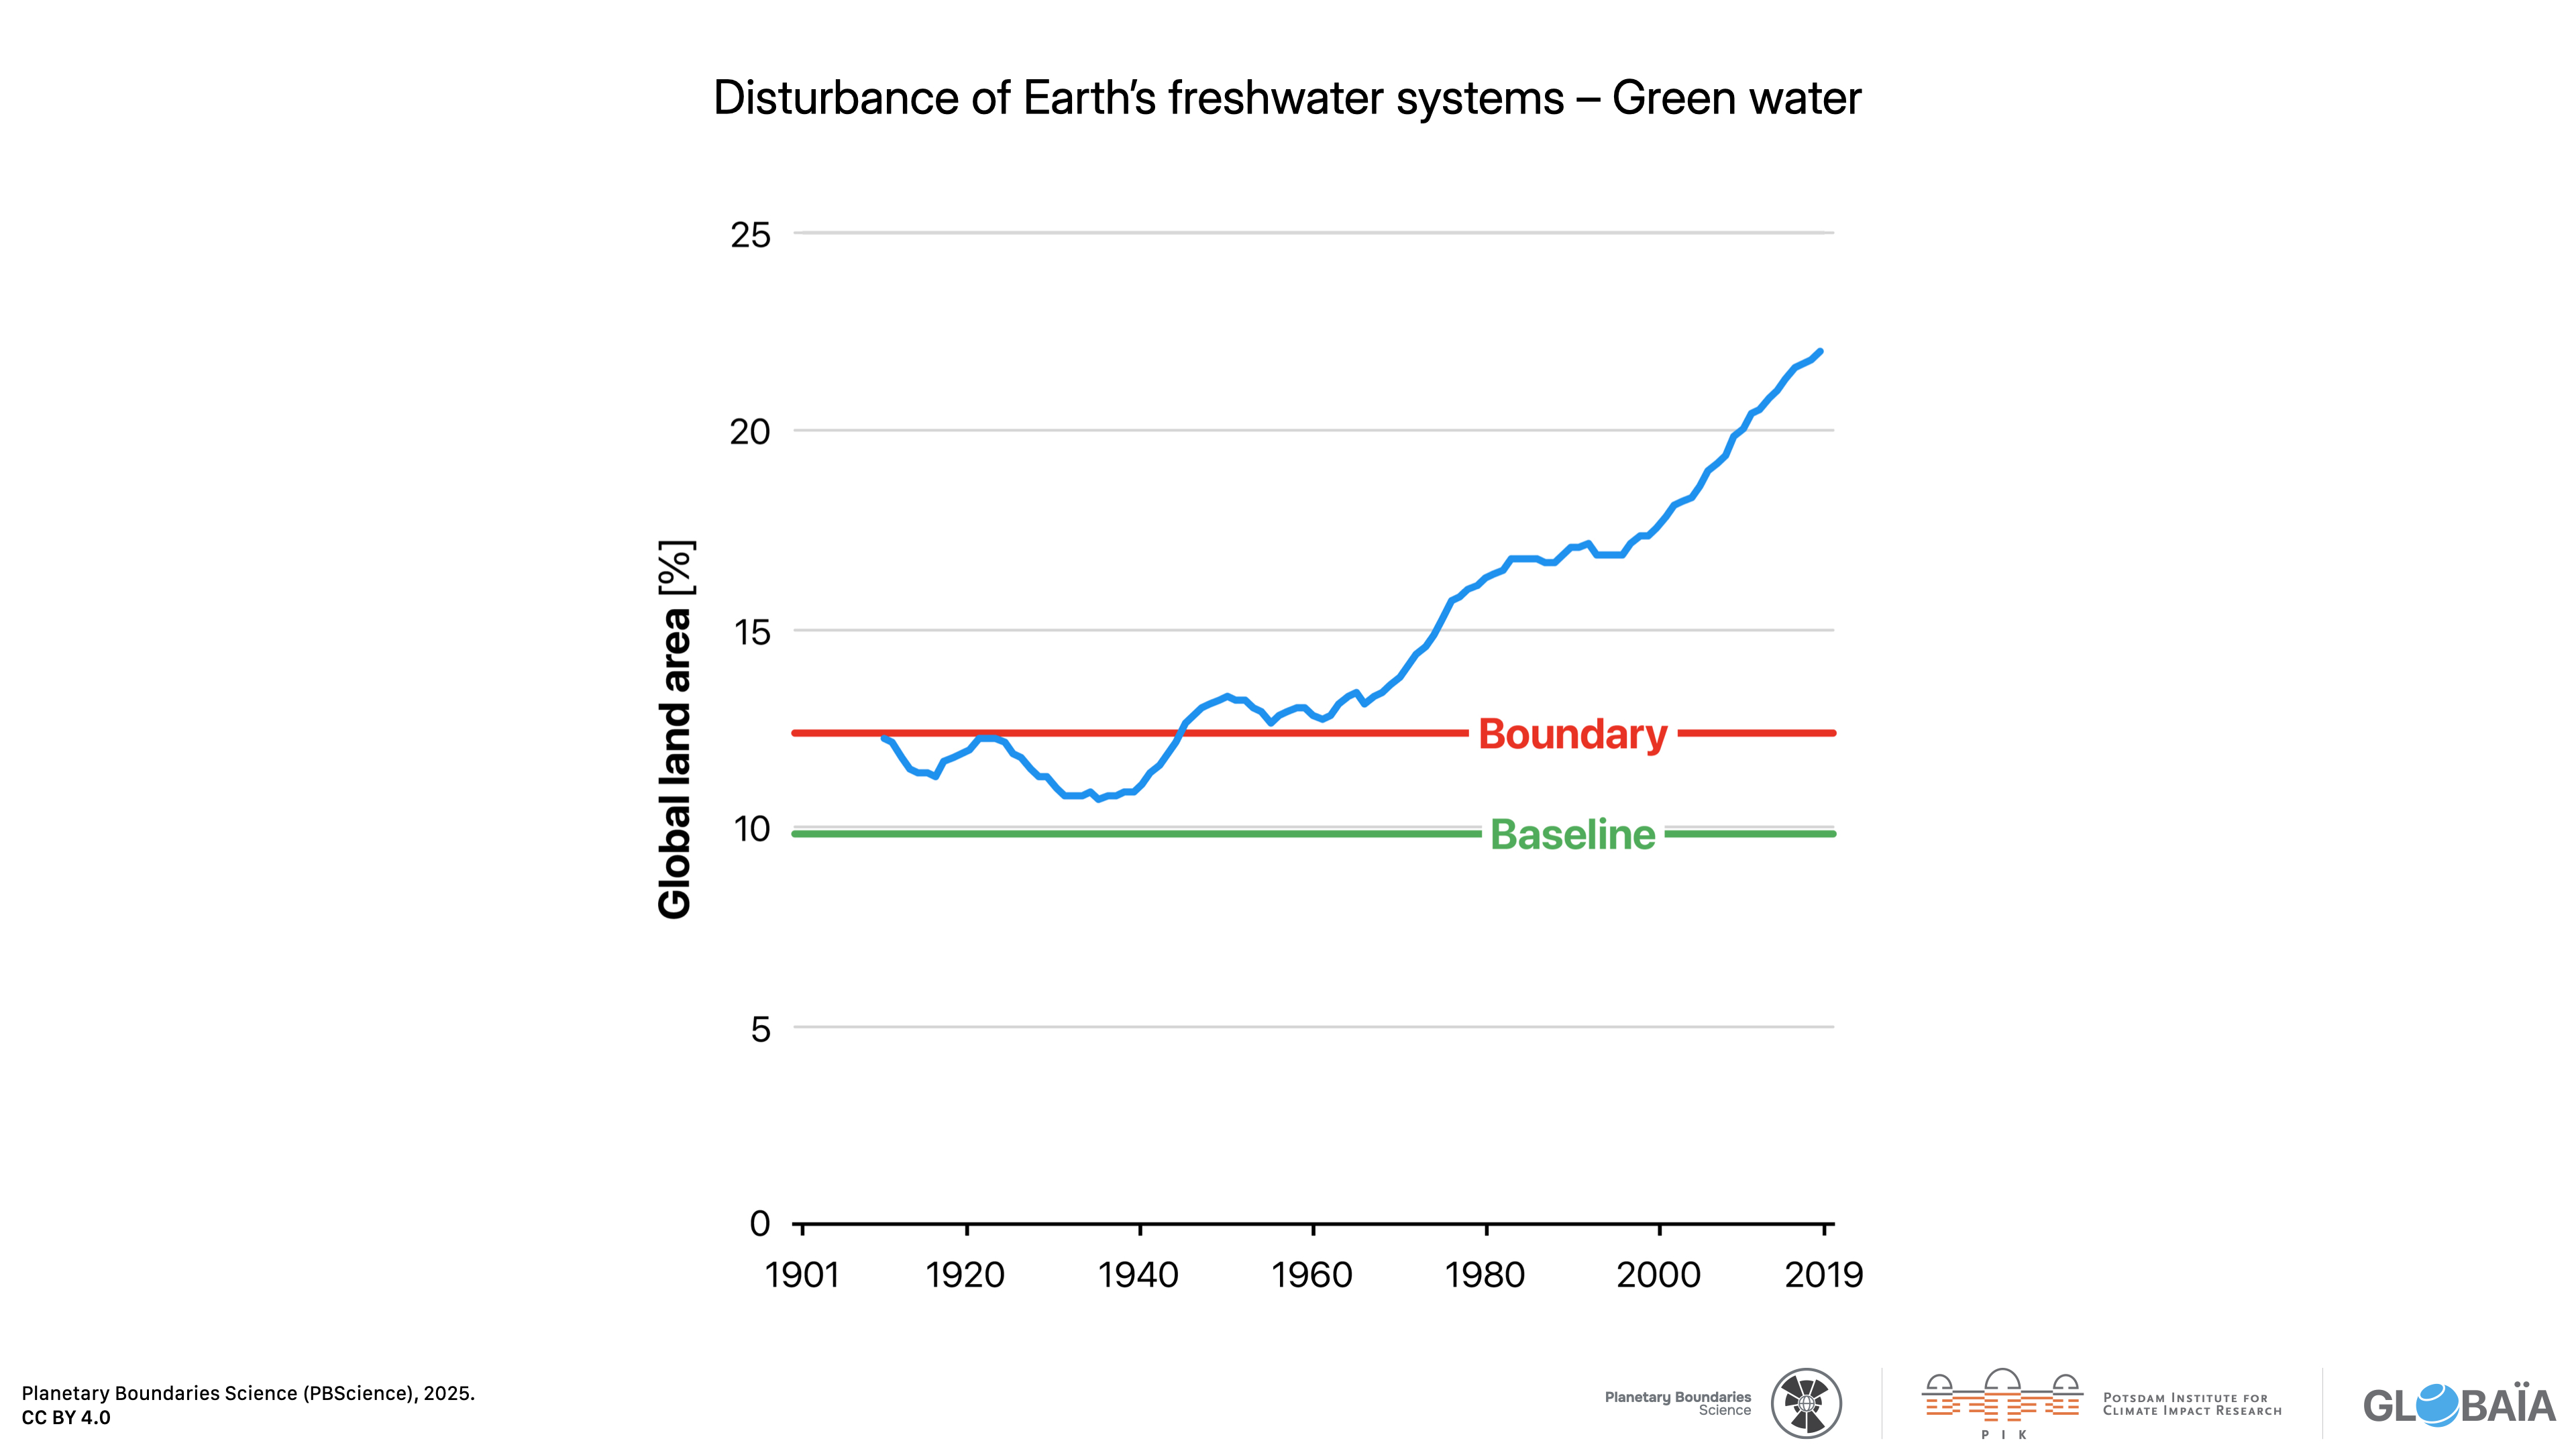
FIGURE 33 – Disturbance of Earth’s freshwater systems (II) – Green water
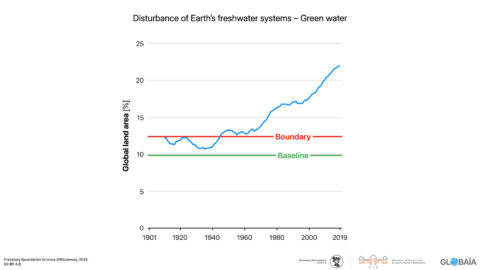
FIGURE 32 – Global risk map of Earth’s freshwater systems (II) – Green water
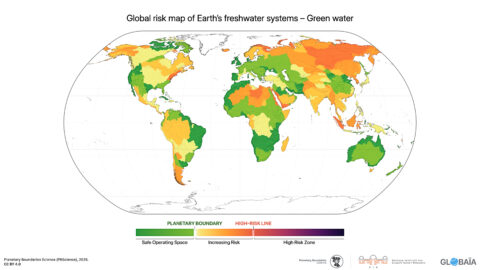
FIGURE 31 – Disturbance of Earth’s freshwater systems (I) – Blue water
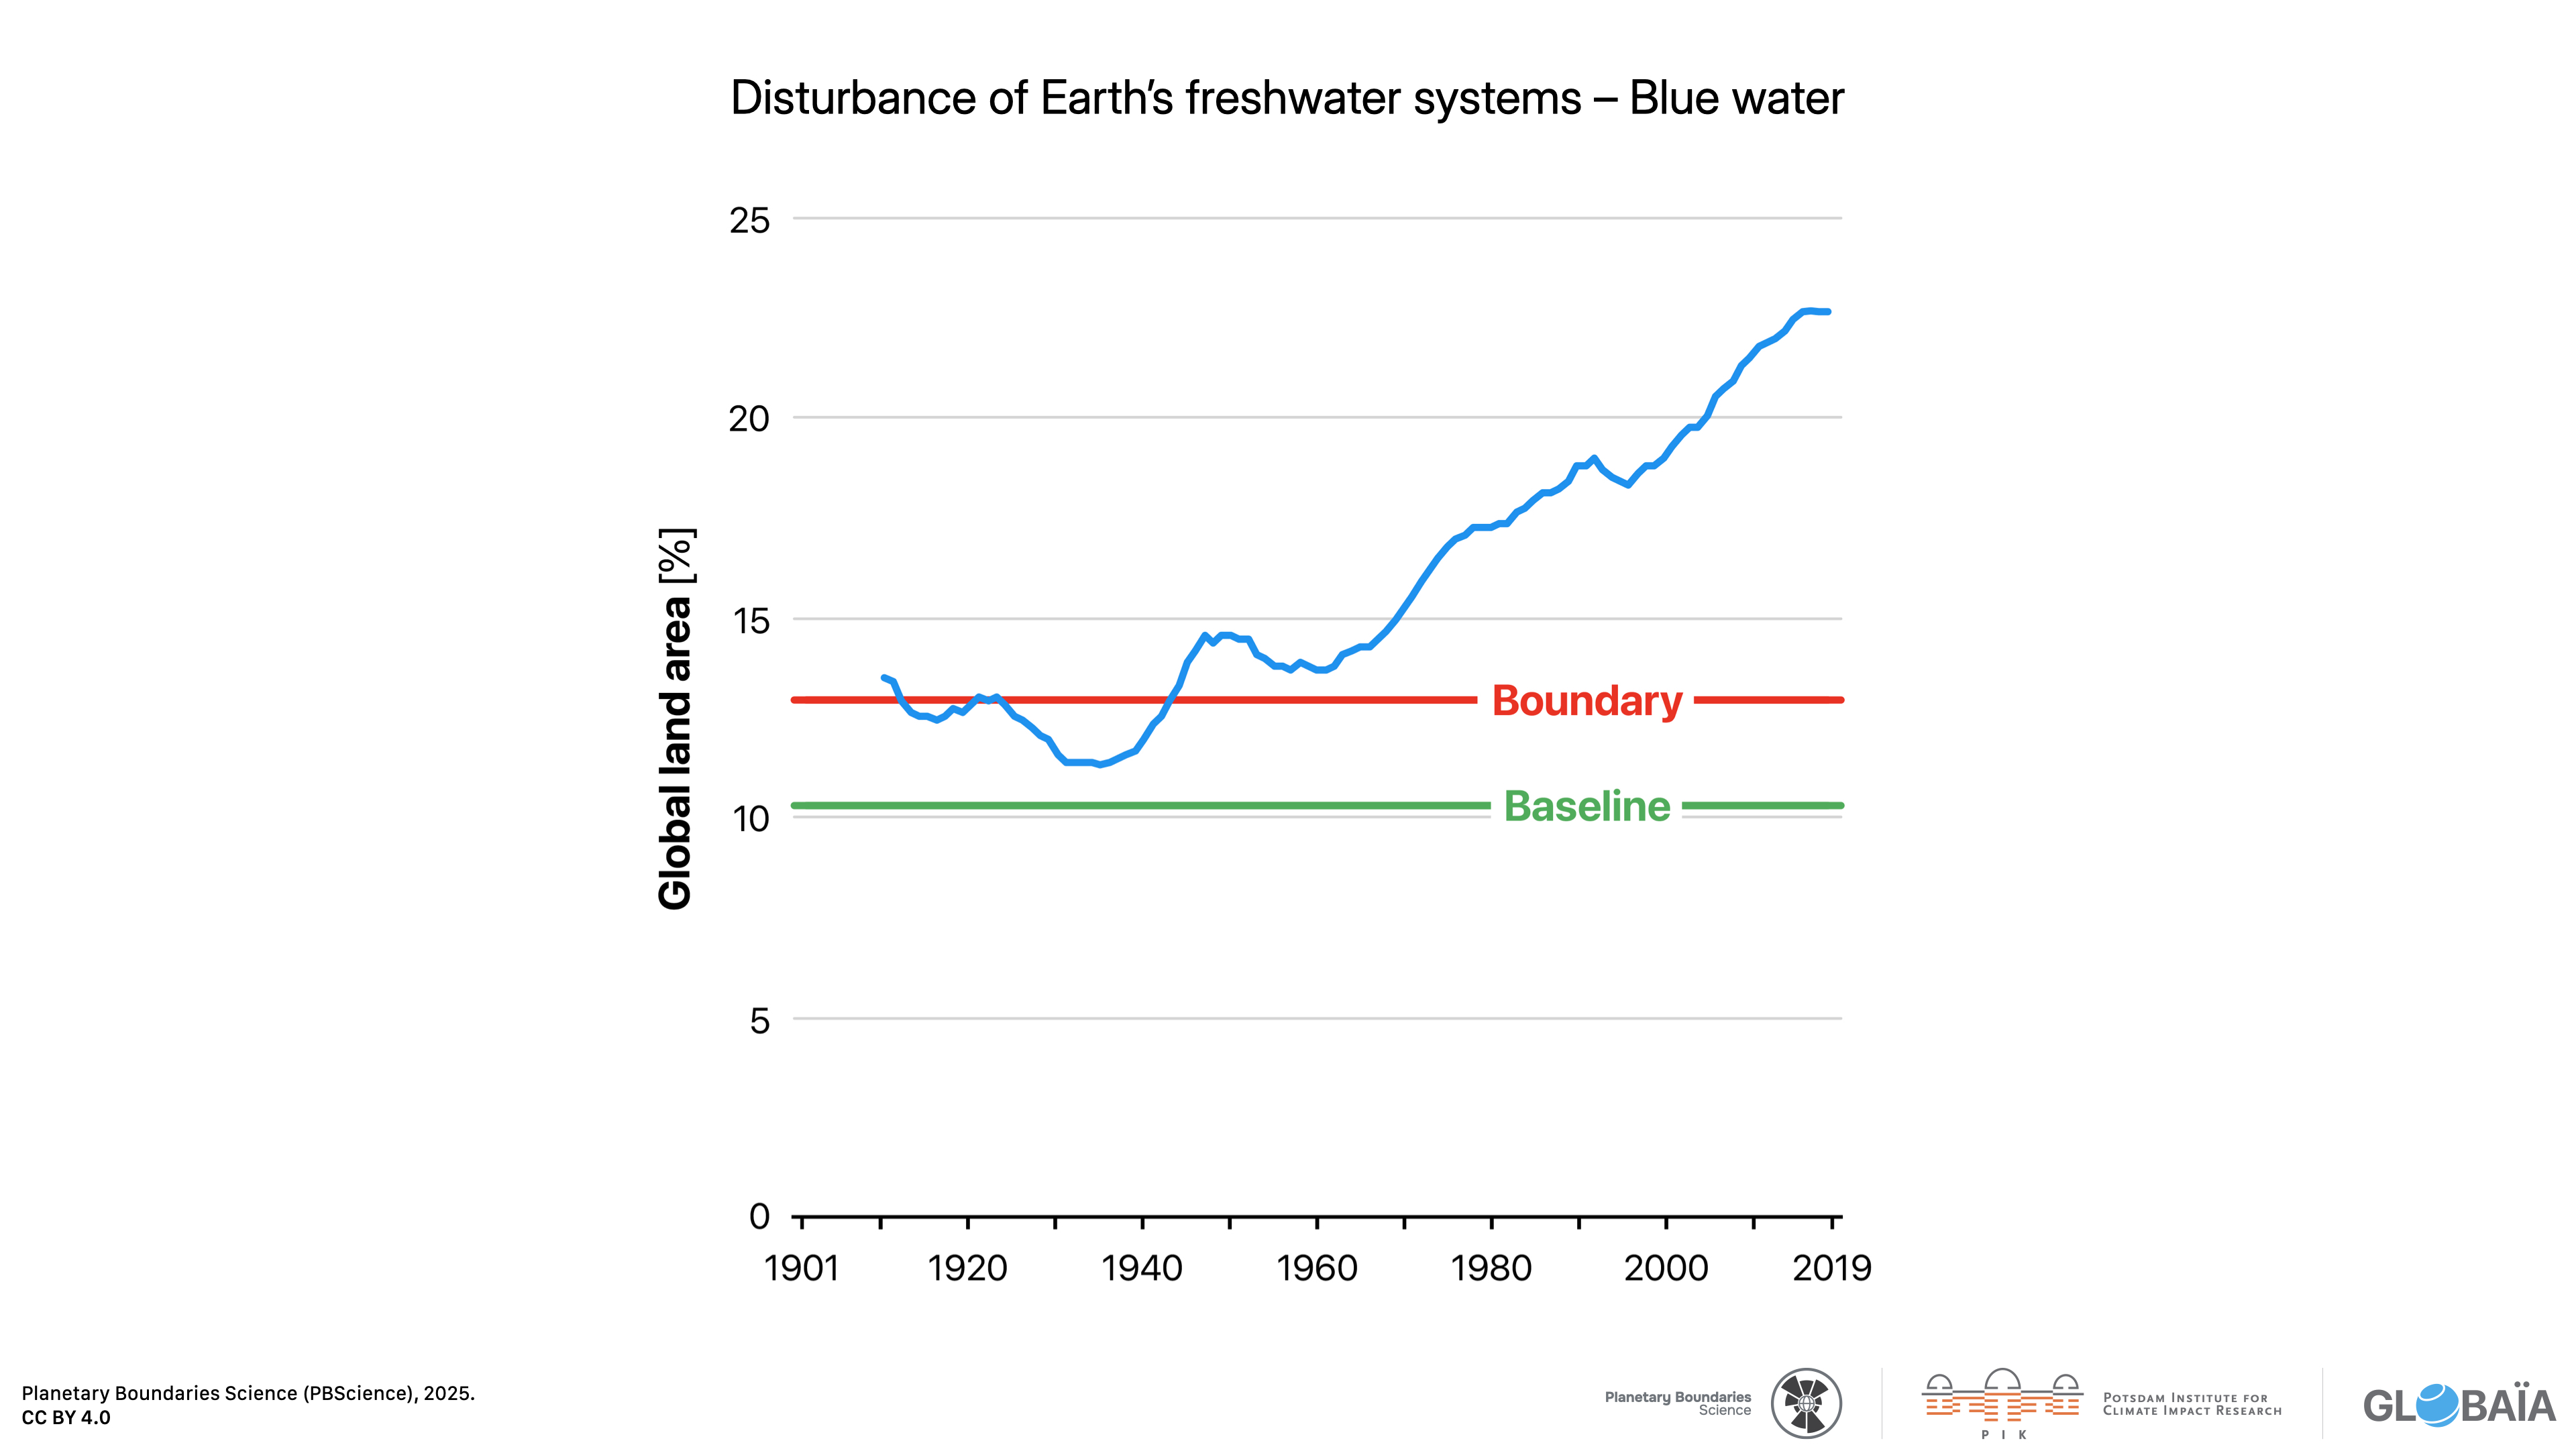
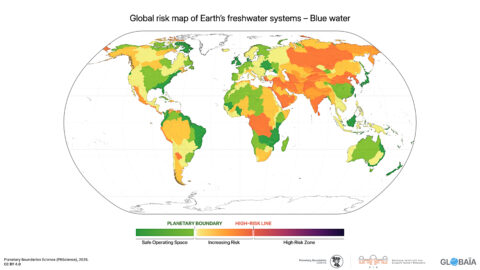
FIGURE 30 – Global risk map of Earth’s freshwater systems (I) – Blue water
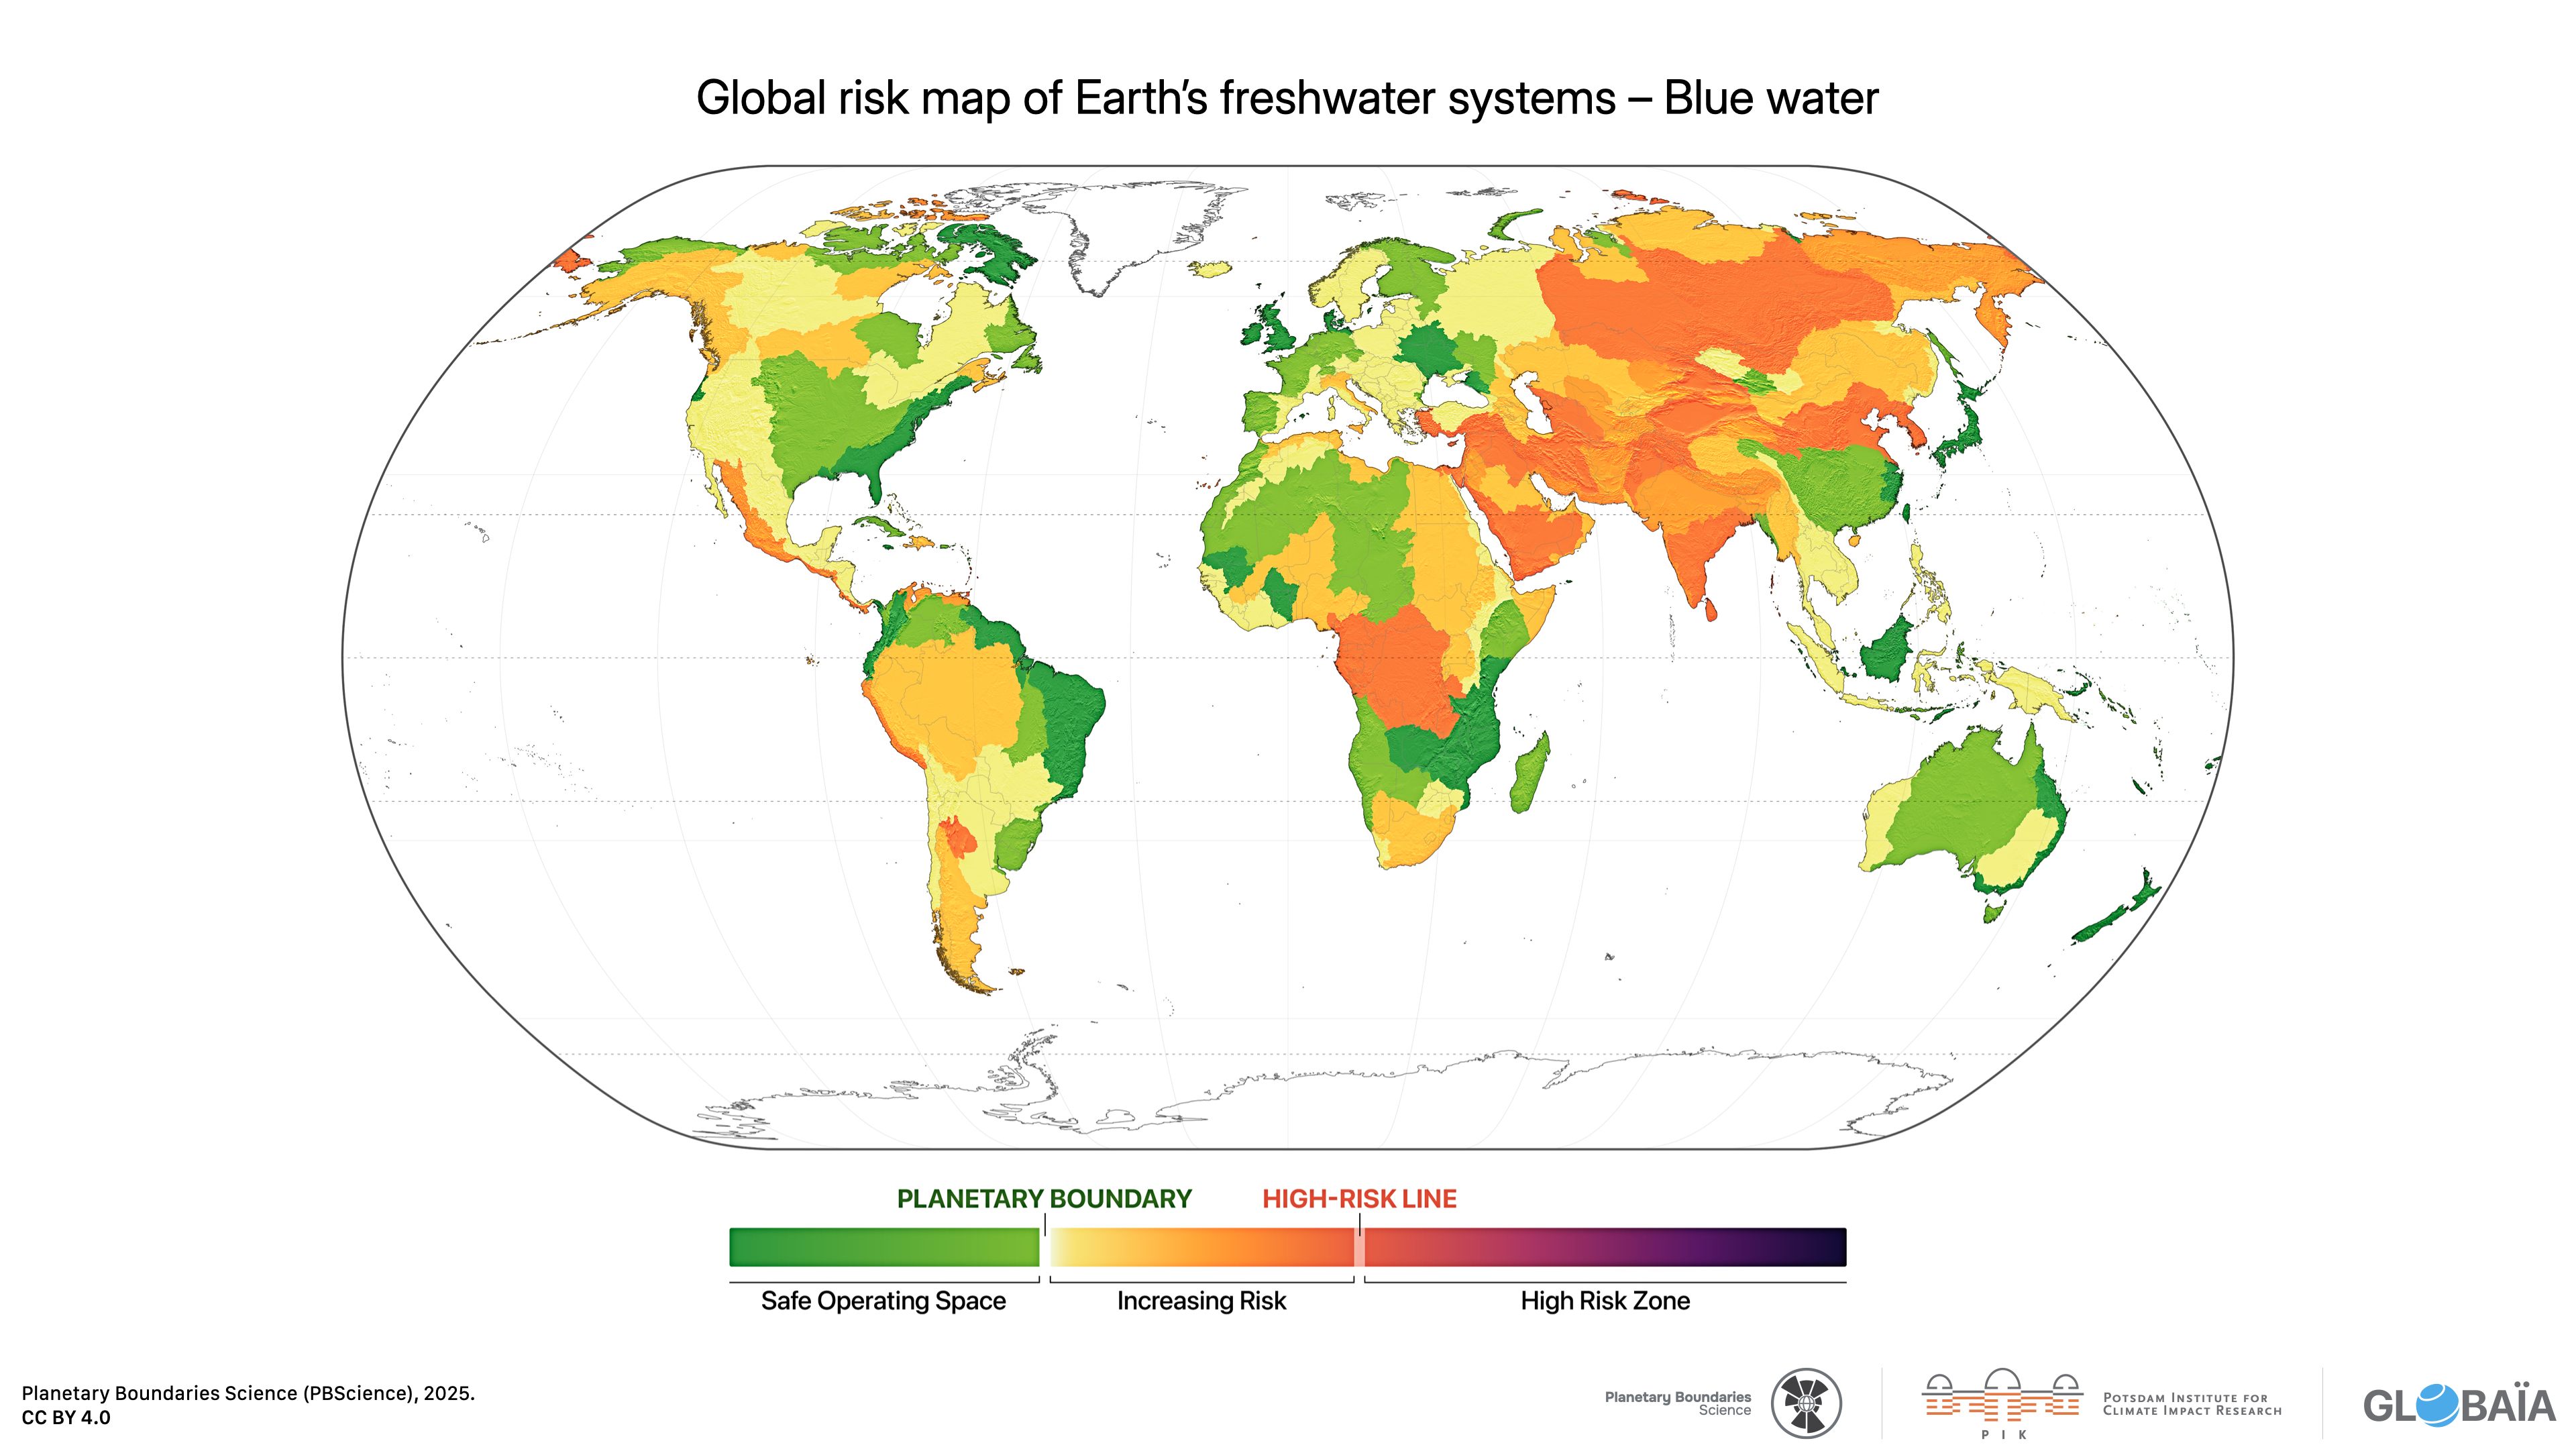